Wednesday, September 30, 2015
Wikipedia's Climate Data on an Interactive Map
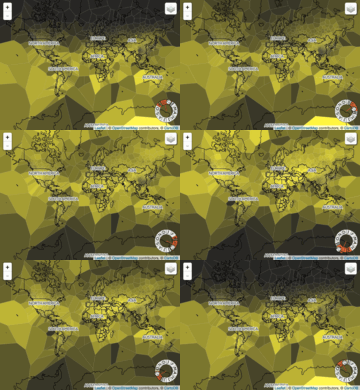
This map/visualization was quite popular this week: Wikipedia's Climate Data on an Interactive Map. I still think these Voronoi maps are ugly and the map seems a bit wonky - I can't figure-out the month wheel. The animated GIFs are fun:


Arctic Ocean Sea Ice 1979 to 2014
Here's another nice animated map with embedded chart: Arctic Ocean Sea Ice 1979 to 2014
Sunday, September 27, 2015
Naomi and Francis
Naomi Oreskes always has interesting things to say about the nexus between climate science and its political, social, and economic implications. Have a look at the recent piece As Pope Francis Meets America, a Climate Science Scholar Offers a Fresh View of the Encyclical for her thoughts on that.
Friday, September 25, 2015
Years You Have Left to Live, Probably
Very cool from FlowingData: Years You Have Left to Live, Probably is a life-expectancy simulator.
Thursday, September 24, 2015

Tuesday, September 22, 2015
Sustainable Growth and Resilience Data Gateway
Talk about packing buzz words into a title: Gateway Supports Sustainable Growth and Resilience. Unfortunately, the actual data gateway is far less impressive in terms of design, functionality, and available data.
Subscribe to:
Posts (Atom)