This is a nice video about an area and issue I'm quite familiar with: glacier recession in Bolivia. I have been to all of these places and she captured the beauty of the landscape and people very well.
Sunday, March 31, 2013
Saturday, March 30, 2013

HERE.stamen.com
This is what happens when you combine HERE.com with Stamen to create HERE.stamen.com - very cool 3D visualizations (I especially like the watercolor option). For now all they have is New York, San Francisco, London, and Berlin. Read more about it at Co.Design.
 |
| Downtown NYC |
Friday, March 29, 2013
Thursday, March 28, 2013
The Future of Visualization (and Mapping): d3
At least according to Edward Tufte: Data-Driven Documents using D3.js. Not sure all my R-addicted friends would agree...What is d3? Here is a good introduction focused on its ability for mapping.
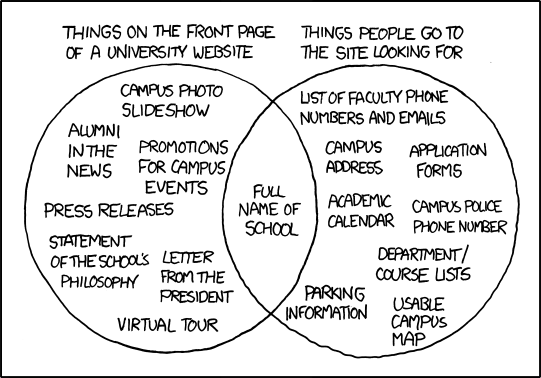
University Websites
Great comic xkcd:
 This follows Conway's Law: the website of an organization mimics the bureaucratic hierarchy of an organization. In the words of Edward Tufte: design replicates hierarchy.
Project Linework
Sometimes all you need as a base layer is a simple, non-distracting outline of a state or a country (especially for thematic maps). Project Linework provides that: clean, effective, and beautiful vector linework. More information from MapHugger.

Tuesday, March 26, 2013
One Millionth Tower
Take an interactive journey through a virtual landscape - this is a cool combination of 3D visualizations and animations: One Millionth Tower (select Just Watch).
Monday, March 25, 2013
Landsat 8!
Finally - the first images from Landsat 8! Normal operations controlled by the U.S. Geological Survey should commence late May 2013.
Saturday, March 23, 2013
Trash in the Oceans
This is a great web map / visualization: coastal pollution and trash floating around in the oceans - viewable as an interactive globe or per source country.
Digital Learners
Some interesting ideas by Joe Kerski (Esri) about what we today call 'digital learners':
- They prefer to access information randomly, rather than sequentially. (??)
- They want to learn simultaneously with others.
- They prefer instant gratification and rewards.
- They prefer learning 'just-in-time' what is immediately useful.
Nothing really new here - we have heard that for years about the so-called 'digital natives'. All I can say that the majority of my students may think that, but are too immature intellectually to pull it of. Plus, they are not technologically competent...unless you consider playing 90s music via Spotify on a smart device while tweeting and vining as relevant technological expertise.
Finally, framing, and advocating for, teaching, education, and learning as a video game is dangerous.
Finally, framing, and advocating for, teaching, education, and learning as a video game is dangerous.
Vertical Farms
This is not really new, but I just came across a nice article in Scientific American (November 2009). The website is also quite interesting:
 |
| Vertical garden at Chicago O'Hare airport |

Thursday, March 21, 2013
Want a GIS job? (Part 2)
Some good thoughts in Science Careers on where the demand for 'new cartographers' is trending today:
- Cartography
- Photogrammetry
- Geodesy
Google's recent report on the economic impact of Geo Services and here's a column by Doug Richardson in ArcNews.
Finally - have a look at Justin Holman's Spatial Career Guide.
Finally - have a look at Justin Holman's Spatial Career Guide.
Tuesday, March 19, 2013

Sunday, March 17, 2013
Want a GIS job ? (Part 1)
This may be a good place to start: Careers in GIS - An Unfiltered Guide to Finding GIS Jobs by Todd Schuble. $9.99 for the paperback, $4.99 for the eBook. Here are some tips:
- Know at least one DBMS (MySQL, PostgreSQL, etc.)
- Learn Python!
- Learn Python!
- Technical knowledge pays!
- Embrace neogeography!
K-12 Technology Use
Very interesting infographic - who pays for all that technology? Much the same trends and discussions are obviously also happening at the college and university level. The same is true for the threat of private online education 'providers' and MOOCs...hmm...I wonder if we should talk more?
Human Development Index
The Human Development Index is a measure for the development of a country in economics, education and health. The Human Development Report 2013, published by the United Nations Development Program (UNDP), contains the HDI for nearly every country in the world from 1980 tot 2012.
Here's an interactive visualization.
Here's an interactive visualization.
Is a College Degree Worth It?
Clearly the answer is Yes! - if the data presented in this infographic are indeed correct. The majors with the highest employment rates include geology, agriculture, and meteorology (??), whereas the highest unemployment rates are found in psychology, computer science, and biomedical engineering (??). That all seems somewhat counter-intuitive to me.
Need GIS Data for Europe?
Here's a good source: Euro Geographics Open Data (requires one-time registration) - available as shapefile or geodatabase.
Saturday, March 16, 2013
Minute Earth
Minute Earth is a new YouTube channel by Henry Reich, the guy behind the awesome Minute Physics. Here's an example:
Tableau Desktop
Tableau Desktop is a great software for data analysis, visualization, and interpretation. The analytics here are critical and represent the link between the pure math and the interdisciplinary uses of data. Now Tableau is free for students and teachers - go and get it!
Here's a great book to get started: Communicating Data with Tableau and here's a blog dedicated to Tableau Tips and Tricks.
Unsure about Tableau? Maybe try Qlik Sense Desktop!
Mapping the Internet...
Yes...there is an app for that! You can view all nodes of the Internet (ISPs, exchange points, universities, etc.) as an interactive 3D globe or a network diagram. Not very useful, but very cool!


Wednesday, March 6, 2013

Tuesday, March 5, 2013
Wealth Inequality
This is a disturbing infographic video: wealth inequality in the U.S. and the difference between our perception of inequality and the actual numbers:
Sunday, March 3, 2013
Friday, March 1, 2013
Another Tweet Map
Here's yet another tweet map - this time global - built on Harvard's World Map platform: TweetMap ALPHA
Subscribe to:
Posts (Atom)