Nice Esri Story Map: Is the American Dream Still Affordable?
Sunday, August 27, 2017
Saturday, August 26, 2017

Friday, August 25, 2017

Thursday, August 24, 2017
Every Road in North America
 |
| https://www.reddit.com/r/dataisbeautiful/comments/6vpnkp/all_the_roads_and_nothing_but_the_roads_oc/ |
Estimating economic damage from climate change in the United States
Or: How Much Climate Change Will Cost Each U.S. County. Now you can see the numbers in a few ways:
- Read the scientific paper and get the data directly from Science.
- Read a summary by Paul Voosen in Science with a large non-interactive map.
- Read a longer article about the study in The Atlantic.
- Explore this interactive map.
 |
| http://www.sciencemag.org/news/2017/06/here-s-how-much-climate-change-going-cost-your-county |

Wednesday, August 23, 2017
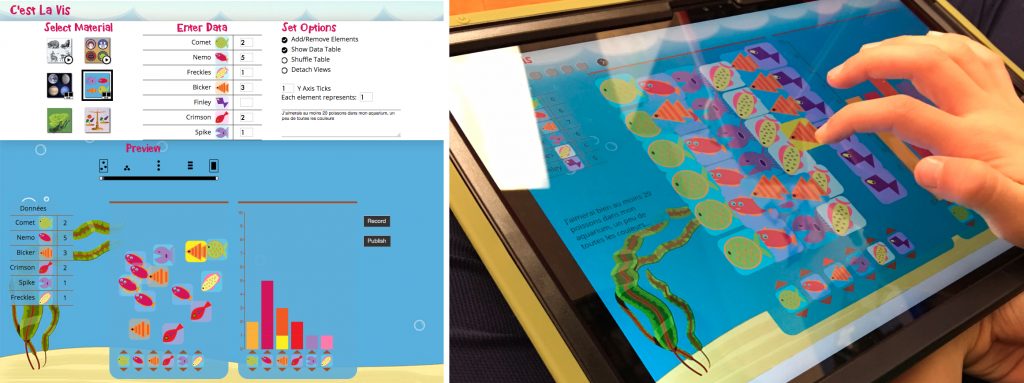
C’est la vis: Visualization Literacy at Elementary School
C’est la vis: Visualization Literacy at Elementary School is super-cute an online platform to teach and learn data viz in grades K and 2. The video explains it nicely.
 |
| https://www.microsoft.com/en-us/research/project/cest-la-vis-visualization-literacy-elementary-school/ |
Sunday, August 20, 2017
AMOS
Need a webcam images? AMOS, the Archive of Many Outdoor Scenes, can help with that. AMOS is a collection of long-term time lapse imagery from publicly accessible outdoor webcams around the world. Images like that are increasingly used, in combination with AI/machine learning, to derive quantitative data.
Tiles for Zoom Levels
MapTiler includes a nice demo to give you the coordinates, tile bounds, and IDs for all tiles for all zoom levels. Nice.
Smart Mapping
Or is it Artificial Intelligence? First Draft GIS creates a draft map for you - all you need to do is provide the data. That does not sound all that impressive, but it can map from news articles, Word Documents, PDFs, Excel Spreadsheets, or any type of webpage - just copy/paste the URL. Try this data set for example.
NYC in 1609, Today, and Tomorrow
This has been around for a while, but the reconstruction of Mannahatta (Manhattan in 1609) is always worth exploring. Visionmaker nyc lets you now go into the future and create quantitative visions for a sustainable city.
Mars over the last 3.8 Billion Years
Rewind the Red Planet (by National Geographic) is a great scrollable story map of the history of Mars over the last 3.8 billion years. If you are really interested have a read at How We Made “Rewind the Red Planet”.
Planet.com
Planet.com offers a bunch of high-resolution satellite data from several satellite constellations that they own. I'm not sure what the free account actually gets you, but their Education/Research Programs seems quite generous. Certainly much higher-resolution than Landsat/ASTER and more accessible than the other commercial products.
OpenAerialMap
OpenAerialMap is an open service to provide access to a commons of openly licensed imagery and map layer services. Download or contribute imagery to the growing commons of openly licensed imagery.
Seems like the available imagery is either standard satellite images that you could get from many sites or UAV images for specific places around the world.
Seems like the available imagery is either standard satellite images that you could get from many sites or UAV images for specific places around the world.
Saturday, August 19, 2017
The Choropleth Sandbox
The Choropleth Sandbox is pretty useful to 'test' how various classification settings have a big impact on the story that your map is telling.
Thursday, August 10, 2017
Between Two Cities
Between Two Cities sounds like a fun and useful game to learn about urban planning.
Tuesday, August 8, 2017
Subscribe to:
Posts (Atom)