Showing posts with label d3. Show all posts
Showing posts with label d3. Show all posts
Tuesday, July 9, 2024
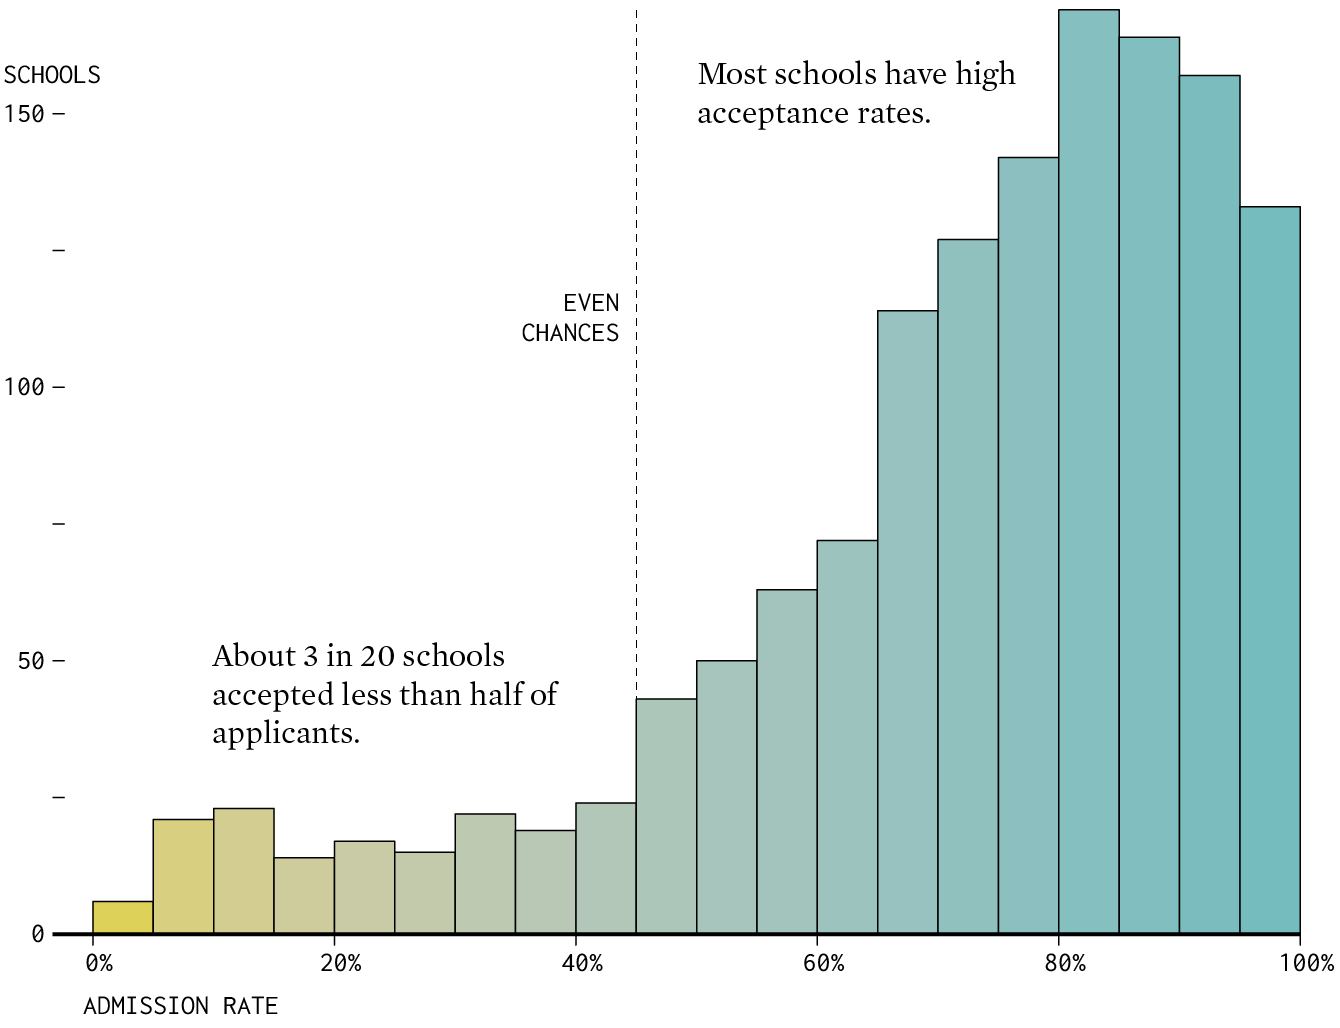
College Admission Rates
Nice data viz from Flowing Data: College Admission Rates for Where You Went to School. Here's the data in-case you want to try your own data viz: https://collegescorecard.ed.gov/data/.

Saturday, May 18, 2024
Visualize This: The FlowingData Guide to Design, Visualization, and Statistics (2nd Edition)
Visualize This: The FlowingData Guide to Design, Visualization, and Statistics 2nd Edition is out! The 1st Edition was great so go get the 2nd one.
Wednesday, September 29, 2021
The Projection Playground
The Projection Playground is fun: look at the world in different projections & you can even adjust the projection parameters to make things even more complicated. Plus you can get the D3 code.
Now: what is this useful for? No idea. For me, there are three challanges related to map projections:
- Make students realize that what (they think) the world looks like is actually just a function of the map projection / parameters.
- Understand the implications of 1).
- For students in my GIS courses: Be able to project GIS data (although that's become less and less important.
Sunday, October 25, 2020
Area vs Population
This is one of these maps that will help (hopefully) the upcoming election results: 50 percent of the US population lives in only 4.6 percent of all counties (see below). County counting to specified proportion let's you adjust the percentage of population - nice!


Friday, November 22, 2019

Wednesday, May 22, 2019
Friday, June 29, 2018
Data Illustrator
Data Illustrator looks great - a browser-based data viz tool - and comes with a nice Getting Started tutorial. The rest is a bit murky, especially their business model, pricing, etc.
Saturday, February 3, 2018
Flourish
Flourish is a new interactive data viz tool, similar in many ways to Datawrapper. People like Andy Kirk seem to like it. The catch, of course, is price: is the free version able to do what you need it to do? If yes = great! If no = pay or learn an open-source tool.
Along those lines: have a look at RAWGraphs.
Along those lines: have a look at RAWGraphs.
Friday, July 28, 2017
Need a Chart? Need a Tool?
The Chartmaker Directory is an attempt to connect types of charts with the most appropriate tools to make them. More about the effort here.
Wednesday, May 17, 2017
The Hitchhiker’s Guide to d3.js
The Hitchhiker’s Guide to d3.js is a pretty nice compilation of all things d3.js.
Saturday, November 12, 2016
Plotly
Plotly is the beginning of the end for d3 = a simple interface for creating great looking interactive charts. Here's a nice example of what you can do with Plotly - click on the Play with this data! links to look under the hood.
Here's a nice compilation of graphs, charts, and other visualizations created with Plotly in 2015.
Even better: Plotly and R (free online course).
Here's a nice compilation of graphs, charts, and other visualizations created with Plotly in 2015.
Even better: Plotly and R (free online course).
Friday, October 21, 2016
Friday, October 7, 2016
Friday, July 15, 2016
Tuesday, March 8, 2016
What I Use to Visualize Data
Not me, but Nathan Yau of FlowingData explains What I Use to Visualize Data - Python, R, d3.js, and Adobe Illustrator. Along the same lines, have a look at What data visualization tools do /r/DataIsBeautiful OC creators use?


Tuesday, January 5, 2016
The 21 Best Data Visualization Tools: Charts, Graphs & Maps
The 21 Best Data Visualization Tools: Charts, Graphs & Maps is a bit misleading as it only covers the 21 best (according to the author) JavaScript libraries for charts and graphs.
Thursday, December 3, 2015
Thursday, November 19, 2015
D3.js and R
Better Data Visualization with Python, D3.js, MapReduce and R has some nice information and links related to those four data analysis and visualization tools, for example:
- D3 Tutorials (by Scott Murray)
- 20 D3 Video Tutorials (by d3Vienno)
- Introduction to Data Science with R - Part 1 (David Langer)
- Introduction to Data Science with R - Part 2 (David Langer)
- Data Visualization Using R (23:45 minutes)
- Combing R and D3.js
Monday, September 21, 2015
Monday, September 7, 2015
Subscribe to:
Posts (Atom)