Saturday, December 23, 2023
Friday, December 15, 2023
Sunday, December 10, 2023
Editing in Map Viewer
Good information here: 5 Tips for Editing Made Easy in Map Viewer.
- Update attributes & add features.
- Create different views for feature layers, for example a non-editable public view and an editable view for your team.
- Create forms to streamline editing - that way you don't edit directly in the attribute table, but rather using a form to ensure data quality & consistency.
Saturday, December 9, 2023
The Tree Equity Score
The Tree Equity Score shoes the patterns that you would expect to see for cities across the USA: rich people get to live with trees, poor people do not. The underlying data is available state-by-state here: https://www.treeequityscore.org/methodology.
Friday, December 8, 2023

Animated Fly-To Map GIFs
Animated GIFs are great: simple & easy! This Fly To app looks like a great way to make animated map GIFs. Read more about it here: https://googlemapsmania.blogspot.com/2023/12/making-animated-map-gifs.html
Thursday, December 7, 2023
Tuesday, December 5, 2023
Monday, December 4, 2023
Our Reddening Globe
Our Reddening Globe is pretty slick: you get a 3D rotating globe, two interactive global and regional time series, and an animation option to place 2023 into the context of 1880 to 2023. Here's the issue that I have: does something like that 'move-the-needle' at all? Sure, it's a cool data viz but it lacks something: a spark, a story - something that would turn this from just another data viz to something that could trigger an emotional response.
Saturday, December 2, 2023
The Coastline Paradox
The Coastline Paradox is not really a paradox, but rather a pretty slick visualization of sea level rise overlaid on Google Street View images from around the world. Nothing new here, but a cool visualization. The one problem here is that this 'only' shows normal sea level rise and not what happens when you add high tide, rainfall, and maye a storm surge - that's when the greatest impacts will occur.
Tuesday, November 28, 2023
OS-Climate
OS-Climate is something, not really sure...but here is their vision statement:
OS-C is establishing an Open Source collaboration community to build a data and software platform that will dramatically boost global capital flows into climate change mitigation and resilience.
Through a non-profit, non-competitive organization, OS-C will aggregate the best available data, modeling, and computing and data science worldwide into an AI-enhanced physical-economic model that functions like an operating system, enabling powerful applications for climate-integrated investing in a world where the future will be very different from the past.
The OS-C technology platform will accelerate development of scenario-based predictive analytic tools and investment products that manage climate-related risk and finance climate solutions across every geography, sector, and asset class. The OS-C Open Source organization will enable alignment of the stakeholder community on priority data and modeling needs, focus shared resources on executing those priorities, and accelerate adoption.
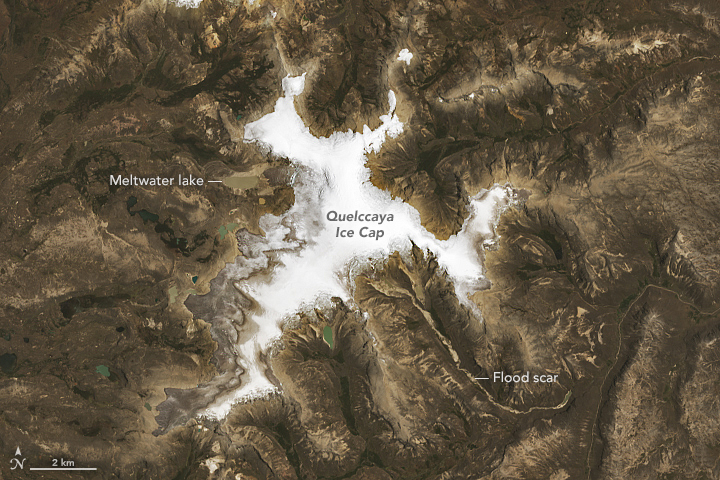
Quelccaya Ice Cap Then and Now
Quelccaya Ice Cap Then and Now shows a pretty stark comparison between the Quelccaya Ice Cap in 1988 and in 2023.
The Protein Problem
The Protein Problem is a pretty cool interactive website / scrolly map. The embedded quiz How do your protein habits compare? could be useful for teaching & learning.
Monday, November 20, 2023
Alternatives to Google Street View
Maps Mania has compiled a nice list of open-source alternatives to Google Street View, for example Panoramax, Mappillary, and KartaView. These apps can be useful to share your own street-level photos, for example for your own project.
Thursday, November 16, 2023
RAWGraphs & Observable
Two interesting data viz options:
- RAWGraphs is free and open-source = great!
- Observable has a free pricing tier & looks similar to Datawrapper.
My personal take: stick with Google Sheets or MS Excel or choose a free and open-source product for your data viz.
Multilingual Surveys
Multilingual surveys are critical - otherwise you are excluding entire groups of people from your dara collection. Seems like ArcGIS Survey 123 allows you to author multilingual surveys right in the web designer - that seems like something that Google Forms should be able to add?
More here: Author Multilingual Surveys in the Survey123 Web Designer
Wednesday, November 15, 2023
Monday, November 13, 2023
Felt
Felt proclaims it self to be "A better way to work with maps. Powerful enough for GIS Pros, easy enough for everyone else". Well, maybe.
- Felt seems like an online web mapping platform to accompany QGIS?
- Seems like they want to position themselves between the Nat Geo Map Maker (= no analysis) and ArcGIS Online.
- Not sure if I would be willing to put my work on a start-up like Felt that may disappear in a few years.
Friday, November 10, 2023
Wednesday, November 8, 2023
Pathfinding
Cool, but not sure how useful: https://honzaap.github.io/Pathfinding/. Define the start and end points and then see the shortest path emerging.
Living Like The Dutch
This is cool: add an address and the AI will 'change' it to what it could look like when you replace cars with bikes, create pedestrian-only streets, and more: https://dutchcyclinglifestyle.com/.
Monday, November 6, 2023
Transit Map Projections
This is kind of cool: you can display public transportation maps in different projections, for examples a geographical projection vs. an octilinear projection that is typically used on the public transit maps.
Sunday, November 5, 2023
750 Myr - Today
Explore what the Earth looked like from 750 million years ago until today using the Ancient Earth Globe.
3D Sea Level Map
The resolution is a little coarse, but the 3D Sea Level Map is fun to play around with - try the Bering Strait region!
Friday, October 20, 2023
Monday, October 16, 2023
Saturday, October 7, 2023
The XRain Map
The XRain Map is useful: display precipitation on a 3D globe, then click on locations of interest to view & download the seasonal data. Nice!
Sunday, October 1, 2023
Classic The Onion
I was reminded of this 2010 classic by The Onion: 'How Bad For The Environment Can Throwing Away One Plastic Bottle Be?' 30 Million People Wonder
Tuesday, September 26, 2023
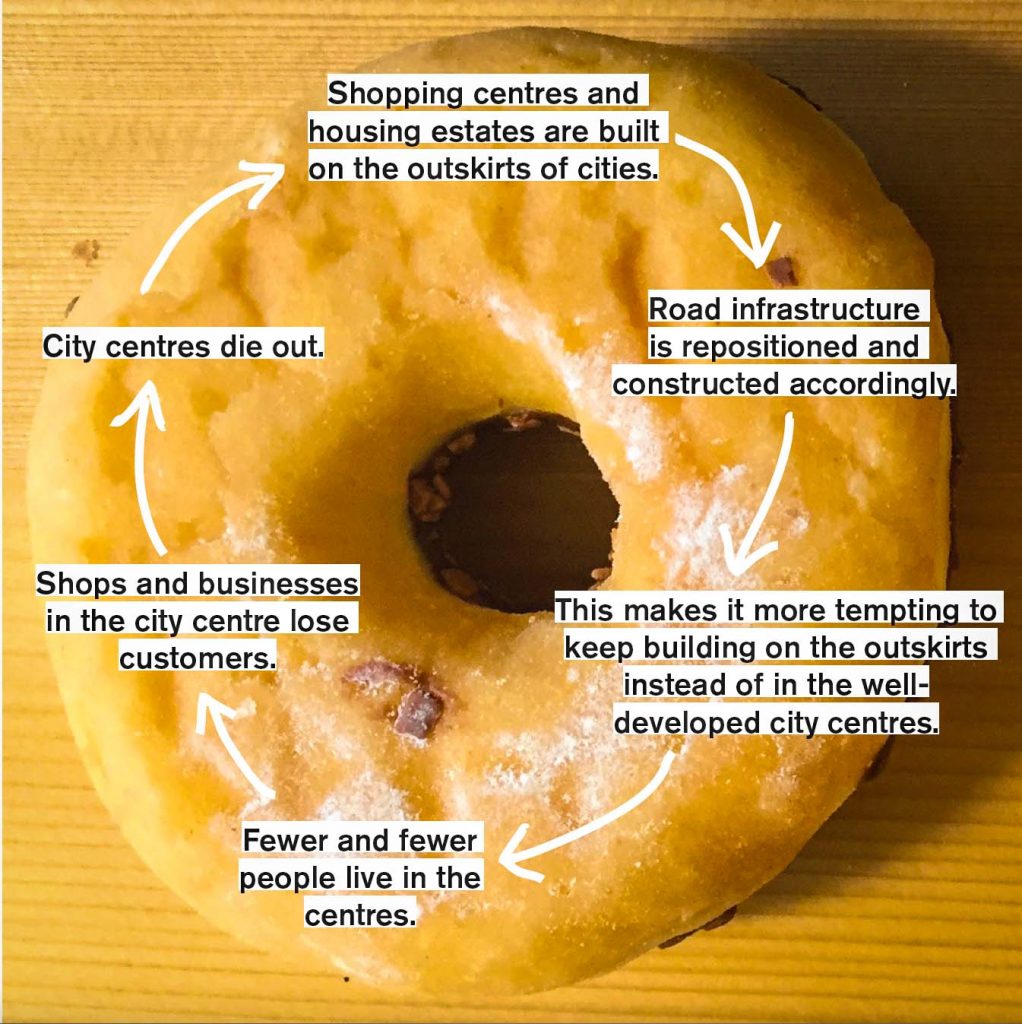
The Downtown Doom Loop
After COVID, average downtown office occupancy is under 50 percent and about 25 percent for San Francisco and Washington DC. Within a city, the second tier Class B offices spaces are especially empty. Therefore, you have no people. And thus the small amount of retail that exists in these office areas is dying: the retail space on the ground floor is a nice feature, but the offices above are supposed to make the money.
Still, there's a strong push to 'return back to normal' & fill-up these offices. Or, do we need to accept the 'New Normal' and do something different?
Wednesday, September 13, 2023
Map Channels Tour Maps
From Map Mania: the new Map Channels Tour Maps.
Seems like an easy way to make virtual 3D Street View tour anywhere - well, assuming that Street View data exists.
Saturday, September 9, 2023
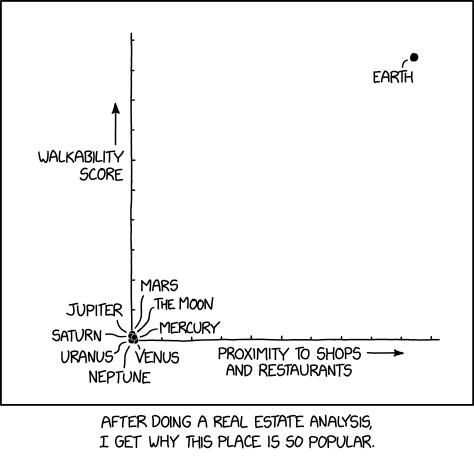
Map of the Best
Seen on MapsMania: Map of the Best.
I like it - this web map simply shows you the best restaurents say in a given city. You can adjust the parameters to your liking, but this web map makes it really easy to find 'the best one' = the one you dine at when you visit for the first time.
Thursday, August 31, 2023
Esri App Builders
This is helpful: Which App Builder Do I Choose?
- You have a web map & want to share it in a cool way: use Instant Apps.
- You want to tell a story & offer context for a general audience: use StoryMaps.
- You have real-time / continously updated data & want to share it with a specific audience: use Dashboards.
- You want the kitchen sink: use Experience Builder.
Basically use Instant Apps or StoryMaps if you want a general audience to interact with maps and use Dashboards or Experience Builder if you want a more specialized audience to interact with data as charts and tables.
Wednesday, August 30, 2023
Open Pedagogy in GIS Education
Have a read: The next layer: Towards open pedagogy in geospatial education (Abernathy 2023). A few comments:
- There's nothing inherently 'bad' about commerical GIS products (= Esri products) and there's nothing inherently 'better' about open-source GIS products - it's all in the way that you use them for teaching & learning.
- GIS teaching & learning does not all of the sudden become 'active' or 'inquiry-based' or 'diverse' or 'participatory' when you use QGIS & an open-source book.
- The vast majority of employees that hire my students use Esri products.
- The biggest challanges for open-source GIS products: 1) there is no pratical solution for a Web GIS and 2) for GIS apps.
- I will continue to use the Esri GIS products.
Monday, August 28, 2023
This Map Does Not Exist!
Or, rather: the world being mapped in this map does not 'exist', other than in the 'imagination' of AI - have a look: This Map Does Not Exist. This is a crowd-sourced attempt to 'guide' AI...the 'meta' version of OSM if you will. Read more about it over on MapsMania.
Saturday, August 26, 2023
Less Glaciers = More Ecosystems?
Or, at least different one? Shrink the glaciers and now you have ecosystems on, under, and around the glacier that will need to adapt. Or, be newly-established.

Interesting stuff! Have a read of The great melt will shape unprotected ecosystems (Nature, 17 August 2023) to learn more. The image below shows the Pedersen Glacier (Alaska) in 1917 and in 2005.

There Will Be No “Climate Havens”
There Will Be No “Climate Havens” is a great read & I mostly-agree...except for one thing: the recent flooding in Vermont has shown us that even the 'safest' place in the country (Lamoille County, VT) can be impacted by extreme weather events. Sure, but:
- This type of flooding is something that does happen normally across New England - that's nothing new. What's different now is a) that these extremes get broadcasted in vivid colors across social media in real-time and b) that these extremes are getting more and more extreme due to global warming.
- Lamoille County, overall, is very white & wealthy and thus has the resources to fix the damages and now to adapt to reduce their vulerability. That's why it still is a 'climate haven'.
XR, VR, AR in scientific research
Good article here: Why scientists are delving into the virtual world. But, it is clear tha XR, VR, AR, etc. are not really used (yet) for actual scientific research, but other ancillary functions such as:
- Virtual meetings.
- Training students.
- Educational outreach.
- Controlling your lab machines / robots remotely.
Here's a good quote: "VR offers a repeatable, standardized clinical training method that is not reliant on the quality of the trainer." Or, being able to access an actual simulation lab or medical dummy.
Now all you need is a set of VR goggles & a super-fast Internet connection!
Thursday, August 24, 2023
Tuesday, August 22, 2023
Marine Geospatial Ecology Tools (MGET)
The Marine Geospatial Ecology Tools (MGET) (by Duke University) is a free, open-source geoprocessing toolbox that can help you solve a wide variety of marine research, conservation, and spatial planning problems.
There you have it - somehow it connects ArcGIS & R via Python.
Photogrammar
Photogrammar (by Yale University) is classic DH: mapping 170,000 photographs taken between 1935 and 1944.
Monday, August 21, 2023
Gamifying Spatial Thinking
Two cool 'geogames' from the RIT: Project Lily Pad and Project EOC - more here: https://www.rit.edu/gccis/geoinfosciencecenter/nsf-reu-outreach.
The Liquid Syllabus
Something to consider: create your course syllabus not as a 'static' PDF, but rather as a dynamic website that displays well on all types of screens.
Sunday, August 20, 2023
ArcGIS StoryMaps Briefings
Not sure this is really all that different from just using a plain-old Sidecar, but here are ArcGIS StoryMaos Briefings:
Thursday, August 3, 2023
The Kids Guide to The Truth About Climate Change
The Kids Guide to The Truth About Climate Change by the 'noted' climate expert Mike Hukabee...I wonder what's in it. Plus he has all kinds of other 'The Kids Guide' that you can get delivered to your door steps once a month!
Tuesday, August 1, 2023
Map Channels v9
Map Channels v9 seems like a nice & quick tool for making personalized Google Maps - worth a try perhaps!
The USA is all white!
Well, at least when you ask the AI Machine: I Asked AI What Europeans Think Americans From Every Single State Look Like, And The Results Are Just Plain Mean.
The Appalachian Trail
Nice scrolly map by the Washington Post: Why the famed Appalachian Trail keeps getting longer - and harder.
Personally I have never understood the obsession with the AT: very little views, tons of rocks & roots & bugs & snakes.
Wednesday, July 12, 2023
The World's Deadliest Epidemics
Great story map: An illustrated history of the world’s deadliest epidemics, from ancient Rome to Covid-19. As an aside - what;s the difference between an epidemic and a pandemic?
- An epidemic is confined to a limited region or community, but affects a large number of people in said region or community.
- A pandemic is an epidemic that is actively spreading across multiple communities and/or regions (countries, continents, etc.)

National Geographic MapMaker
The National Geographic MapMaker (by Esri) is great - try it!
One thing to add: after making their map, students need to be able to 'save' it as a unique URL so that they can share it with others, including their teacher. The PDF export & screenshot functions are great, but then you loose the interactivity.
Tuesday, July 11, 2023
Stats with R or Python!
Nerd alert: An Introduction to Statistical Learning is now available in two versions - one with applications in R and one with applications in Python. That's already pretty awesome & now add that both versions are free to download as a PDF!
Monday, July 10, 2023
El Nino + Humans = Hot!
So, June was hot. How hot does not really matter - the hottest June in 1000, 2000, 10000, or 100000 years - who cares! This becomes a classic red herring for the deniers to exploit & gets us discussing the specifics, nuances, and uncertainties associated with paleoclimatology. Here's all you need to know: Human-caused global warming combines with natural climate variability (El Nino) into what we are experiencing as weather. Here are two good videos:
Thursday, July 6, 2023
What's the best font?
Here's an issues best avoided: stressing-out over fonts! The best advice for most of us is simpe: use a serif font for text and a sans-serif font for data, tables, chart labels, etc.
That being said: What’s your type? Try these tests to pick the perfect font for you from the Washington Post is a nice demonstration how changing the font impacts the way you read and write.
Wednesday, July 5, 2023
Monday, July 3, 2023
Monday, June 26, 2023
Color & Contrast
An interactive guide to color & contrast (by Nate Baldwin) is just that - a comprehensive guide for exploring and learning about the theory, science, and perception of color and contrast. The details get a little wonky, but the section on UI & Data Visualization offers sound practical advice.
The Smart Grid
The biggest problem in the USA with respect to the transition to sustainable energy sources is our old and outdated (aka 'dumb') electrical grid. Why the U.S. Electric Grid Isn’t Ready for the Energy Transition (by the NYT) is a nice visual illustration and explanation of the problem.
The solution? A new smart electrical grid! Sure, that's a big challenge, but ultimately just an engineering challenge. Here's an interesting approach: Solutionary Rail - electrify the railroads and create corridors for clean electrons.
Wednesday, June 21, 2023
From Python to R
The Starter Guide For Transitioning Your Python Projects To R walks you through the differences between Python and R and includes a nice tutorial.
Thursday, June 15, 2023
Sunday, June 11, 2023

Friday, June 9, 2023
Urban Exodus
Here's a great interactive analysis by the SF Chronicle of net migration in & out of counties across the USA. These spatial patterns are really interesting and the analysis looks at driving factors such as income, etc.
The CDR Primer
Visually-stunning website and free online book: The Carbon Dioxide Removal (CDR) Primer
I'll have to read it, but I am sceptical...
Saturday, June 3, 2023
The McCheapest
Simple map, but so many questions arise: How much does your Big Mac cost?
- Location - these patterns are preety obvious (urban areas, along highways, etc.).
- Patterns of cost - what impacts the price of a Big Mac?
- How are patterns of location & cost perhaps connected to demographic variables such as income, health, race, political affiliation?
Details abd statewide data are available here: https://pantryandlarder.com/big-mac-inflation/
Wednesday, May 31, 2023
Mapping 1,001 Novels
Great example of the digital humanities: 1,001 Novels: A Library of America, presented as an Esri Story map. I tried something like that here for a single book: The Bonobo and the Atheist Story Map.
Monday, May 29, 2023
AI-Generated Maps
Not sure I would call these 'maps' - to me maps really need to represent reality.
- Latent Diffusion (converts text to images)
- AI-generated maps: Copyright, ownership, metadata (from Spatial Reserves)
Thursday, May 18, 2023
The Old Man of the Mountain
Pretty nice Esri Story Map: The Old Man of the Mountain in 3D
Could have 'spiced' this up a little with more context and more science!
Tuesday, May 2, 2023
Mapping Books
Seen on Maps Mania: A Visual Book Recommender is an interactive map of 51,847 books organized by similarity. Using the map you can discover new books to read by searching for your favorite books and exploring other 'similar' nearby books.
Friday, April 28, 2023
Wednesday, April 26, 2023
Inexpensive 3D Printer
Looking for an inexpensive 3D printer for the classroom? The X-MAKER 3D Printer may be just what you are looking for!
Thursday, April 20, 2023
Wednesday, April 19, 2023
The Final Word For Now
Newish meta-analysis / review paper: On the History and Future of 100% Renewable Energy Systems Research (Breyer et al. 2022). Read the whole thing if interested or just the last paragraph:
The main conclusion of the vast majority of 100% renewable energy systems studies is that such systems can power all energy in all regions of the world at low cost. As such, we do not need to rely on fossil fuels in the future. In the early 2020s, the consensus has increasingly become that solar PV and wind power will dominate the future energy system and new research increasingly shows that 100% renewable energy systems are not only feasible but also cost effective. This gives us the key to a sustainable civilization and the long-lasting prosperity of humankind.
Wednesday, April 12, 2023
The GB Renewables Map
The GB Renewables Map is pretty cool - shows a) the relative insignificance of hydropower and b) how wind power is used to replace non-renewable energy sources.
Friday, March 24, 2023
Mapping Parking Lots
Is Your Town a Parking Lot? by Maps Mania is a nice compilation of parking lot web maps/apps.
Monday, March 20, 2023
Saturday, March 18, 2023
Climatological Database for the World's Oceans, 1750-1850
This is cool: Climatological Database for the World's Oceans, 1750-1850. But, the map also highlights one of the fundamental problems of weather & climate data: uneven spatial coverage.
Saturday, March 4, 2023
Energy Literacy
It all starts with the commodity flow charts created by LLNL:
Then there's the interactive and more-detailed version here: http://www.departmentof.energy/
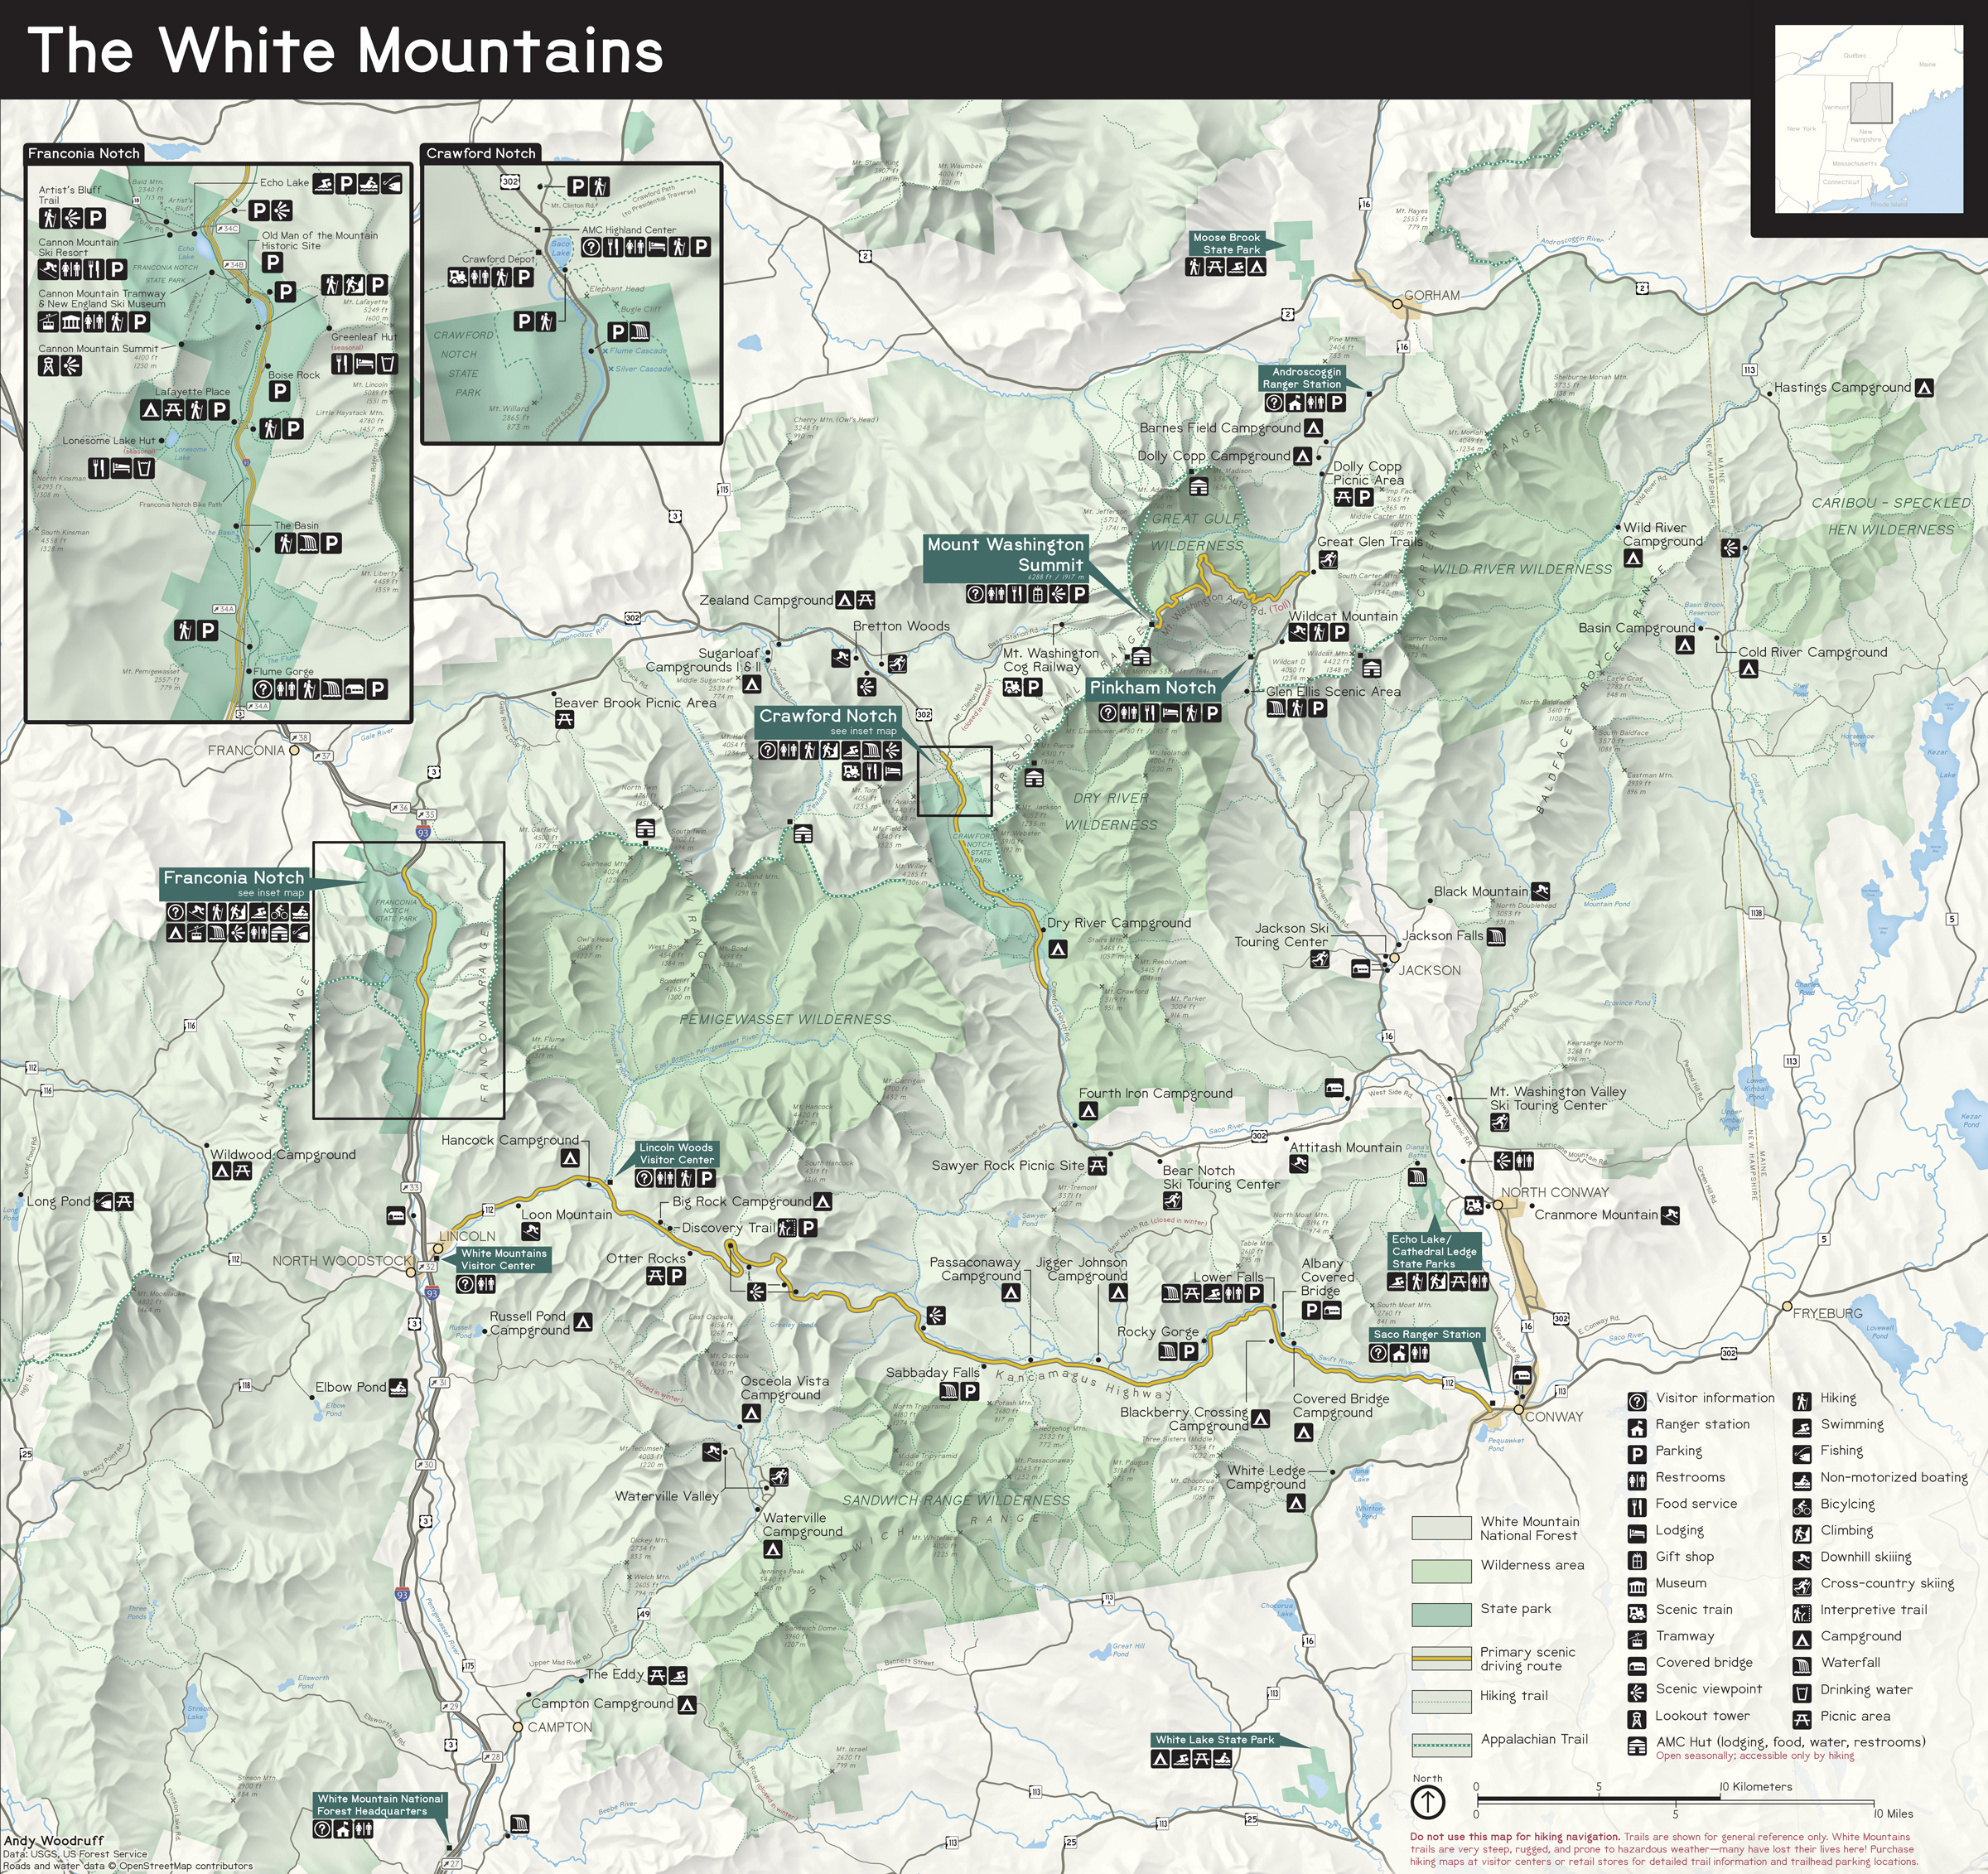
The White Mountains Maps
Great design by Andy Woodruff - a new map of the White Mountains in the style of the classic US National Park maps: White Mountains "National Park" Map.
Friday, February 17, 2023
Death & Global Warming
Explore the links between climate change, temperature and human mortality: Will global warming make temperature less deadly? In-short: More deaths from heat, less from cold. The article / data viz also links the peer-reviewed papers visualized.
Monday, February 13, 2023
ICESat-2 Topography across the Super Bowl
That's just cool: mapping the topography across the Super Bowl LVII stadium with ICESat-2: A Super View of Arizona.
The World Data Viz Prize (2023)
Explore & get inspired @ https://informationisbeautiful.net/visualizations/world-dataviz-prize-2023-shortlist/. I like the distinction between static & interactive.
Tuesday, February 7, 2023
Scrollytelling Video Story Map
Not sure what you would call it, but it slick: The Tragedy of North Birmingham
Sunday, February 5, 2023
Let's Move!
Okay, let's assume that we a) want to move and b) have the ability to move - where are the safest places and the most-risky places in the USA in terms of climate change impacts?
- THIS Is the Safest Place to Live in the US as the Climate Changes
- Which U.S. Cities Are Safest From Climate Change?
- Is the Great Lakes Region Ready for an Influx of Climate Migrants?
- What is the RISKIEST Region in the US as the Climate Changes?
Much of this is based on this ProPublica report: New Climate Maps Show a Transformed United States. The maps and visuals arr great, but scroll-down all the way to the table that ranks all counties in the USA.
For context, here is the economic side of the argument: Estimating Economic Damage from Climate Change in the United States.
Thursday, February 2, 2023
Wednesday, February 1, 2023
Thanks Esri...
Thanks Esri for making this whole Story Maps thing even more complicated: first there was the 'classic' Story Maps with all the great templates, then came in 'new' Story Maps with the cool immersive blocks, and now we get https://storymaps.com/. I'm just wondering what happened @ Esri behind the scenes...anyways...here's the official word from Esri: Esri’s Storytelling Solutions: An Overview.
Thursday, January 19, 2023

Wednesday, January 18, 2023
Your Own Wind Farm
This is pretty fun to play around with: Visualizing wind turbines in 3D using threebox
Saturday, January 14, 2023

Friday, January 13, 2023

Thursday, January 12, 2023
ArcGIS Experience Builder
The ArcGIS Experience Builder is (almost) too much power: image combining the powers of Story Masp, web apps, dashboards, and the WebAp Builder into one. Now you get an interactive playground of pages, embeds, widgets, and more. That's cool. The interface is still a little wonky and confusing, but I'm sure Esri will clean it up.
That being said: I'm not sure what the use case is here. It seems like an awfully-complex option to share your web maps and most people are probably better off using Story Maps and web apps to keep things simpler.
Get started with this tutorial: Get started with ArcGIS Experience Builder
Monday, January 9, 2023

Friday, January 6, 2023

Atmospheric River Lashes California
Atmospheric River Lashes California (NASA) includes a cool combination of images:
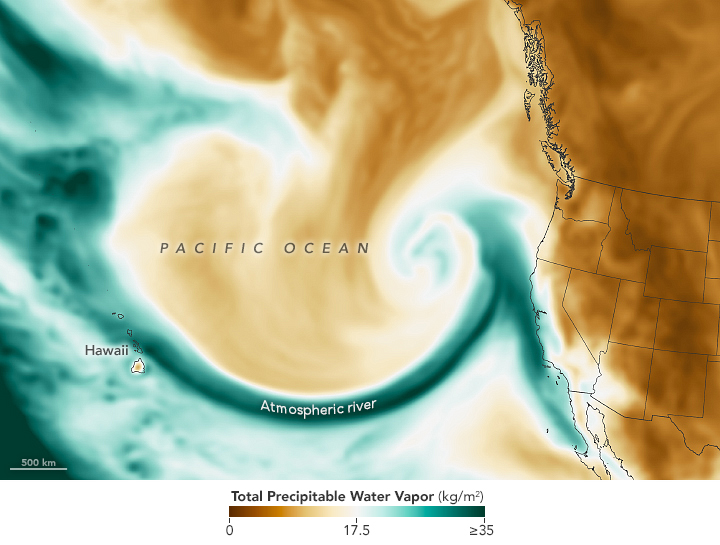
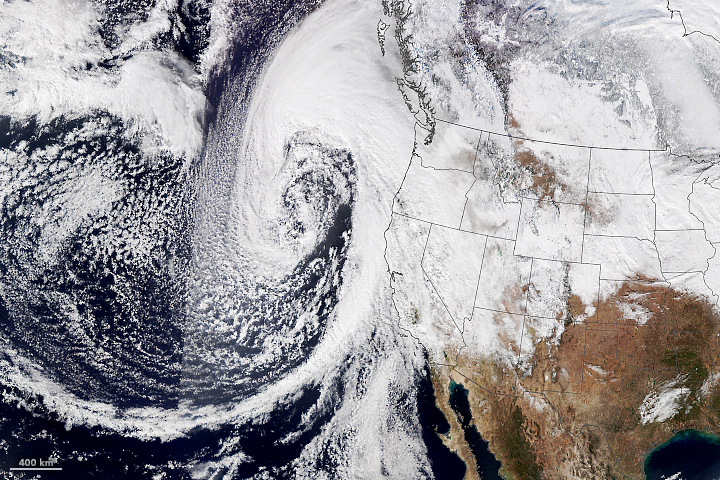
Good information about atmospheric rivers from NOAA: What are atmospheric rivers?
Monday, January 2, 2023
SatelliteXplorer
SatelliteXplorer is a fun way to explore all the satellites that are orbiting our planet. I had no idea that SpaceX owns almost 43 percent of all satellites!
Sunday, January 1, 2023
Subscribe to:
Posts (Atom)