Thursday, January 29, 2015
Mapping America's Futures
Futures - plural! Mapping America's Futures allows you to make assumption regarding births, deaths, and migration and map/chart the resultant population across the country as a function of state or commuting zone - all interactive and with a clean design. Plus you can get all the data!
Wednesday, January 28, 2015

Tuesday, January 27, 2015


Monday, January 26, 2015
Rivers of the USA and Europe
This maps caused some stir recently: the rivers of the USA and Europe colored by flow direction.
Sunday, January 25, 2015
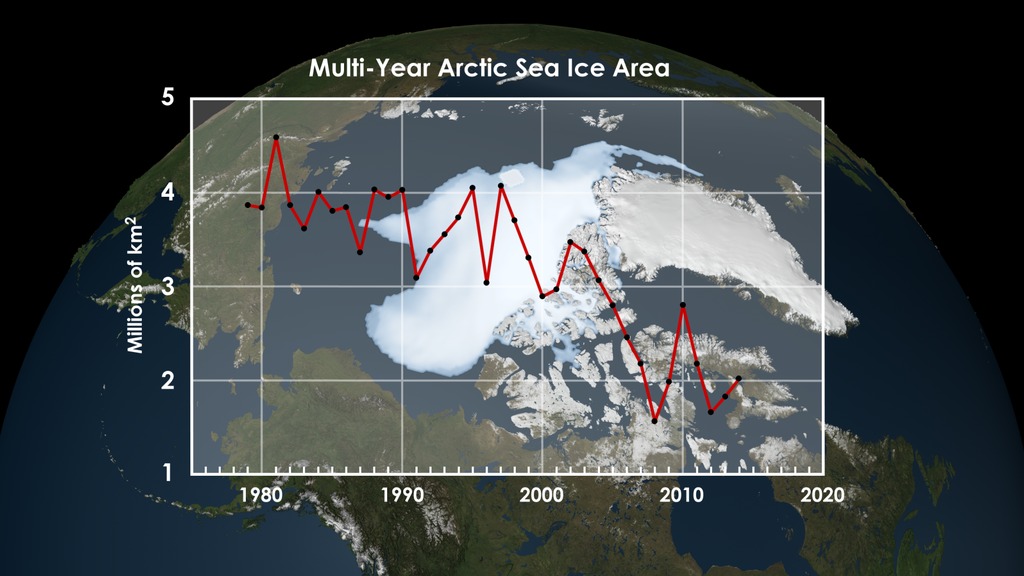
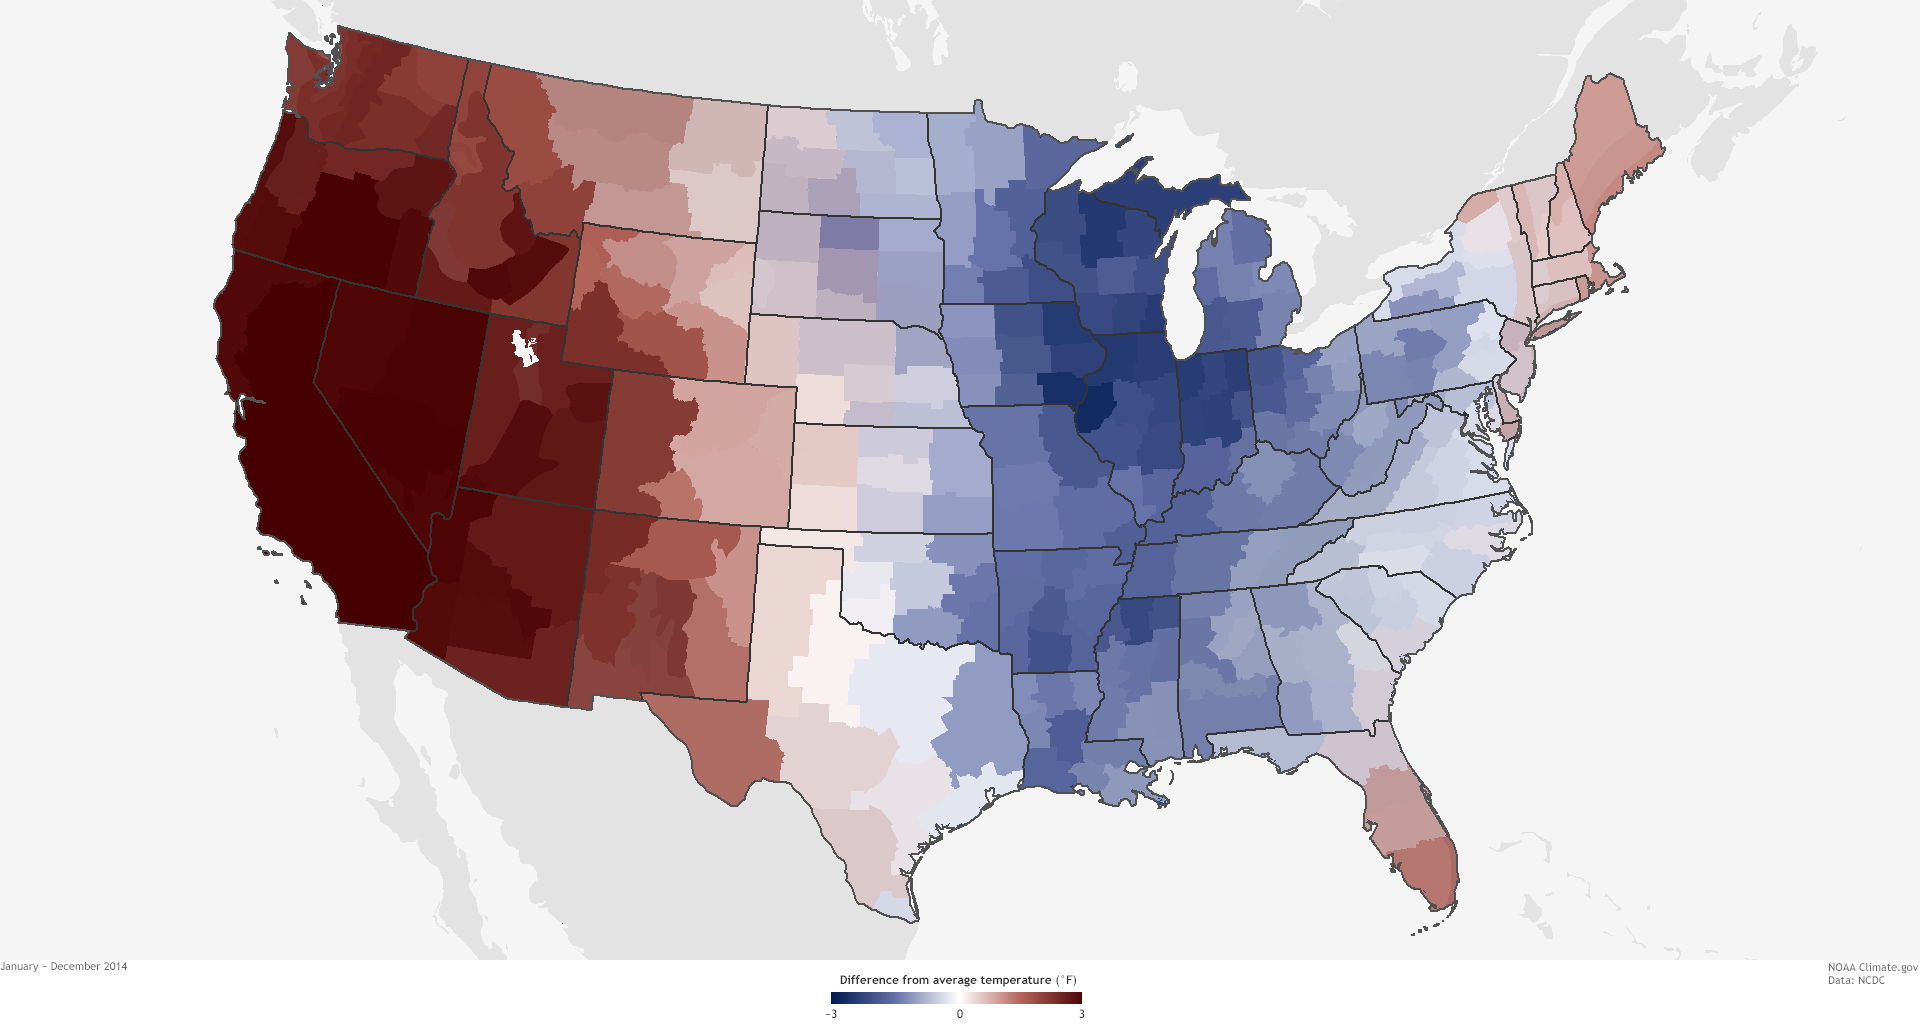
2014 in context
Here's last year (2014) in the context of the last 134 years (since 1880):
- NASA 2014 Temperature Anomaly
- NOAA/NASA Annual Global Analysis for 2014
- A Closer Look at the Global Warming Trend, Record Hot 2014 and What’s Ahead (NYT Dot Earth)
- 2014 Was the Hottest Year on Record (great animation by Bloomberg News)
- Global warming in Belgium
 |
| NYT, 16 January 2015 |

Friday, January 23, 2015
The Map of Life
Very cool: Map of Life - what species are at risk and where do they (still) occur? Moreover, you can model their habitat characteristics.

Shp to 3D Printer
This should be easy enough (in theory): Using shp2stl to Convert Maps to 3D Models
Thursday, January 22, 2015
gps4sport
gps4sport is fun: record a video while recording a GPS and display them together in 3D Google Earth. I tried it today skiing at Okemo - have a look! (fast-forward to about 40 seconds when the video starts).

Mapping the State of the Union Address
1,410 different spots on the globe referenced in 224 speeches!
Patchwork Nation USA
Patchwork Nation is a demographic/geographic breakdown of the nation as an interactive map that reveals the complexity of the USA beyond the simplistic red and blue, Northeast and Midwest. Similar idea: Social Explorer.
Wednesday, January 21, 2015
Learn To Code!
The What code should you learn? infographic has a nice summary and history of different programming languages. At the end...it doesn't really matter all that much - for GIScience I would recommend Python, maybe JavaScript, and something like R or MATLAB.
Need convincing? Have a look at Pick Up Python!
Speaking of Python: Learn to be a Python Charmer compiles a bunch of great resources to get you started.
Here's another infographic: Which Programming Language Should I Learn First?
Need convincing? Have a look at Pick Up Python!
Speaking of Python: Learn to be a Python Charmer compiles a bunch of great resources to get you started.
Here's another infographic: Which Programming Language Should I Learn First?
Monday, January 19, 2015
Database Apps for Data Collection
Database apps enable you to create custom 'apps' to suit your specific data collection needs.
- Filemaker Go 13 and here's an example of using it for archaeological research.
- HanDBase Database Manager
Then there is GIS Pro and GIS Kit for iOS - great apps, but pricey!
Smart Gizmos for Fieldwork
Smartphones and tablets (aka smart gizmos) are ideal tools for fieldwork and data collection - here is a compilation of useful resources and information:
- Tablets for Outdoor Labs and Fieldwork
- Apps for Outdoor Labs and Fieldwork
- Tech-Enabled Field Studies (Book Review)
Read about applications and use here: Streamlining Field Data Collection with Mobile Apps (Camp and Wheaton, EOS, 9 December 2014).
Sunday, January 18, 2015
Friday, January 16, 2015
MapBox and TileMill
I'm not impressed so far as I'm trying to reproduce the Adventures in Mapmaking: How to Map the Age of Buildings in Your Hometown using MapBox and TileMill.
Thursday, January 15, 2015
GPS Visualizer
GPS Visualizer has been around since 2002 and offers fun and useful mapping tools for GPS data and more:


Best of the Year (2014)
It's this time of the year where everybody compiles their best-of-2014 lists, so here we go:
- Kenneth Field @ Cartonerd: Favourite maps from 2014
- Keir Clarke @ Maps Mania: Maps of the Year
- Keir Clarke @ Maps Mania: The Funniest Maps of the Year (2014)
- MapCarte: 365 maps of 2014
- MapHugger: 5 Favorite Maps of 2014
- Visualoop: 100 interactive maps of 2014 - part I
- Visualoop: 100 interactive maps of 2014 - part II
- Nathan Yau @ Flowing Data: The Best Data Visualization Projects of 2014
- MapLab @ Wired.com: Our Favorite Maps of the Year
- Tiago Veloso @ Visualoop: 20 new data viz tools/resources of 2014
- Betsy Mason @ Wired.com: 25 of the Most Interesting Photos of Earth From Space This Year
- Betsy Mason @ Wired.com: NASA’s Best Images of Earth From Space in 2014
- Brandon Keim @ Wired.com: The Best Science Visualizations of the Year
- Co.Design: The 18 Best Infographics Of 2014
- Visualoop: Interactive visualizations of 2014 - part I
- Visualoop: Interactive visualizations of 2014 - part II
My personal favorite: http://earth.nullschool.net/
Tuesday, January 13, 2015
Monday, January 12, 2015
Saturday, January 10, 2015
14 Carbon Hot Spots
Here is a nice infographic of the 14 'carbon' hot spots around the world = places and projects that are producing a lot of fossil fuel and thus carbon emissions: Ground Zero for Climate Change - 14 Carbon Hot Spots
Thursday, January 8, 2015
Mapping Fracking in North Dakota
This is a great interactive map: North Dakota oil boom (see embedded version below). Even better, Mason Inman explains and discusses his mapping procedure and decisions.
Wednesday, January 7, 2015
Datavisual
Datavisual is yet another one of these online data viz tools/websites/apps (others include, for example, Plotly or Datawrapper). You can pick from the standard chart types, upload your data, style the interactive chart, and export as image, vector, or web embed code (see below).
Tuesday, January 6, 2015
Correlation and Confidence
Here are two excellent visual explanations of two often-misunderstood statistical concepts: correlation and confidence intervals.
Monday, January 5, 2015
Climate Stability and the Six Americas
I seriously doubt that the majority of survey respondents really understood what they were answering...

Liberals vs. Conservatives
Obviously it's not that simple...and the Pew Research folks have sliced the US population into 8 groups based their attitudes and values: The Pew Research Center’s Political Typology
This is somewhat similar to Global Warming's Six Americas.
This is somewhat similar to Global Warming's Six Americas.
Sunday, January 4, 2015
College Majors (1970 to 2011)
Interesting graph from NPR Planet Money: what college majors have increased or decreased over the last 40 years?
- Almost one quarter (!) of all Bachelor's degrees are in business.
- Education has dropped from 22 to 6 percent.
- Health professions have increased to almost 10 percent.
Thursday, January 1, 2015
Landsat 8 Mosaic August 2013
NASA 'welded' together swaths of Landsat 8 data for this (mostly) cloud-free map of the USA:
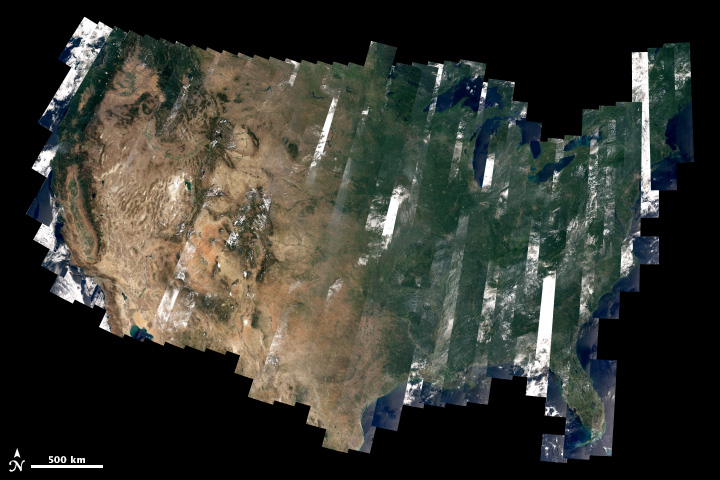 |
| http://earthobservatory.nasa.gov/IOTD/view.php?id=83099 |
Subscribe to:
Posts (Atom)