 |
| https://flowingdata.com/2020/06/24/bad-bar-chart/ |
Thursday, June 25, 2020
Wednesday, June 24, 2020
Kilembe Flooding (May 2020)
I was there last summer - this is devastating for this community. Here's the JustGiving crowd-funding link by Andrew Wielochowski.
Tuesday, June 23, 2020
The WebPlotDigitizer
The WebPlotDigitizer is awesome: a) add a chart, b) 'georeference' it, c) get the data. Way back in the 1990s there was a PC-based tool like that.
Monday, June 22, 2020


Saturday, June 20, 2020

Thursday, June 18, 2020
Wednesday, June 17, 2020
(Glacier) Timelines
Cool science-art project visualizing glacier recession in the Swiss Alps: Timelines. I really like the dual drone footage (see example below). For more 'traditional' data viz approach, see this: So schmolzen die Schweizer Gletscher in 160 Jahren weg.
Getting to Know Web GIS, fourth edition
Getting to Know Web GIS, fourth edition is out today. This is a good book, really. And I like books. And I think tutorial books are very useful. But - still - actually printing a book like that for something like as dynamic as Web GIS feels a little too-retro perhaps in 2020.
Saturday, June 13, 2020
Morphcode Explorer
Morphcode Explorer looks super-cool: it's basically an urban analysis tool to access location information based on any geography. Of course, there's a catch: it is currently only available for NYC and will probably only be available for major cities around the world. Until then: use Esri's BAO and CAO.
Tuesday, June 9, 2020
The Rise and Fall of Coronavirus Cases
Great chart and animation by ProPublica: States Are Reopening: See How Coronavirus Cases Rise or Fall (embedded as an animated GIF below).


The Conspiracy Theory Handbook
Here's something that connects climate change and COVID-19: conspiracy theories! The Conspiracy Theory Handbook by Stephan Lewandowsky and John Cook explains how to identify and deal with those.

Monday, June 8, 2020
May 2020
Yep, May 2020 was a warm one. Just not in central/eastern Europe, Australia, and much of the eastern USA.


Friday, June 5, 2020
Thursday, June 4, 2020
Python Scripting and ArcGIS Pro
Looks like Esri Press is releasing two new books: Python Scripting for ArcGIS Pro and Advanced Python Scripting for ArcGIS Pro.
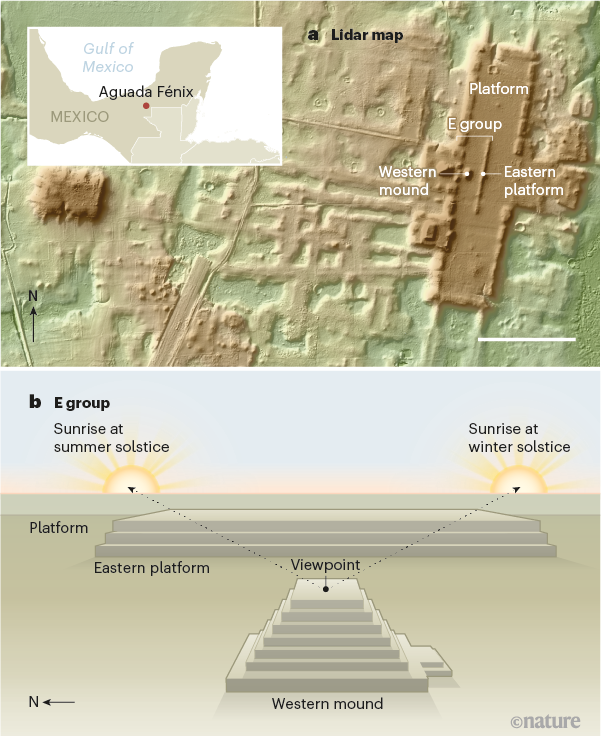
Mapping under the forest canopy
This is not new at all, but a nice example what you can do with Lidar: Large-scale early Maya sites in Mexico revealed by lidar mapping technology.
Monday, June 1, 2020
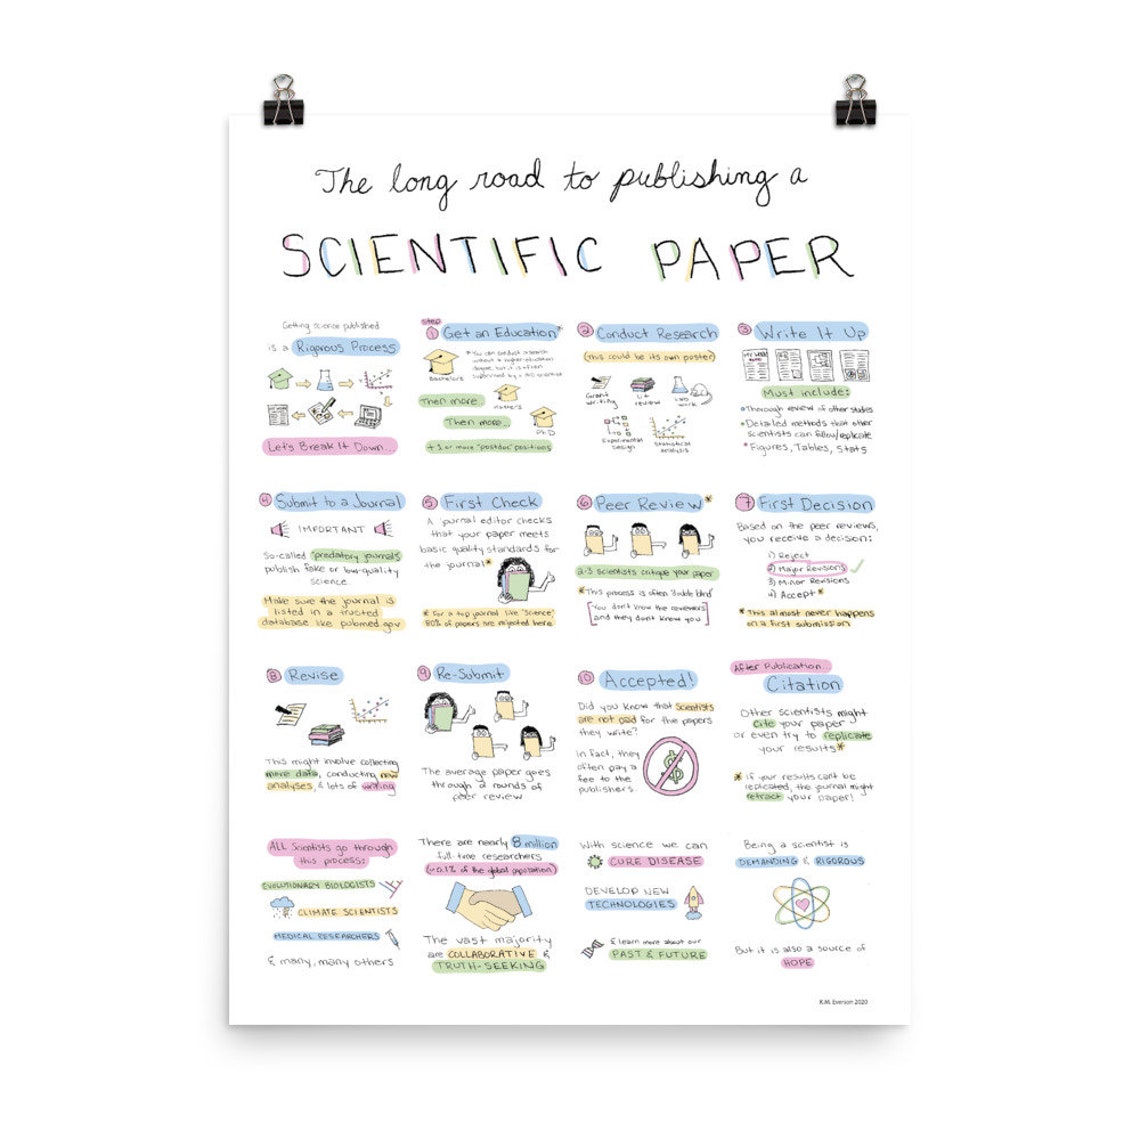
Publishing a Scientific Paper
This is great: The Scientific Publishing Process ($20 on Etsy). You can also look at the individual panels on Flickr.
 |
| DataWorthSeeing on Etsy |
Subscribe to:
Posts (Atom)