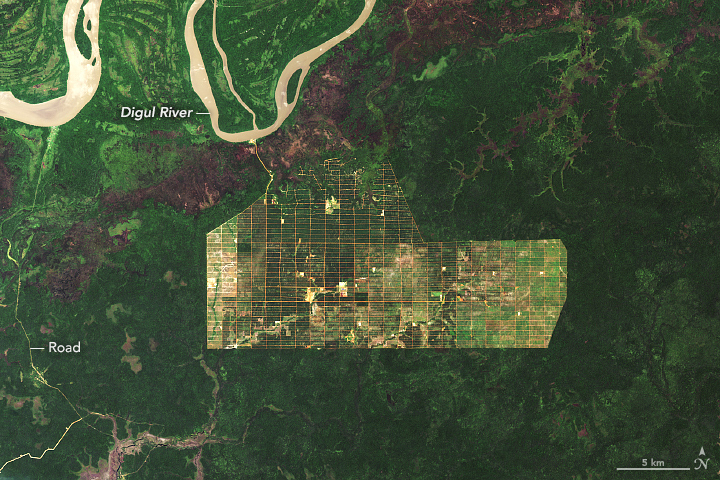
Deforestation in Papua is a great example what can happen between 2002 and 2019.
This is a great post: Five questions for better data communications walks you through a data viz process.
Here's a great quote: I slowly came to realize that I was assigning my audience the tedious task of figuring out for themselves what the takeaways were. My visuals should have been highlighting the interesting things to those seeing them for the first time.
Also called nuisance flooding or sunny-day flooding - one of the first and most-noticeable impacts of global warming and associated sea-level rise. The High Tide Flooding App is pretty slick and you can look at different high tide flooding probability scenarios through 2100.
Great animation by The New York Times of ocean circulation in the North Atlantic and how it may be impacted by melting of the Greenland Ice Sheet: In the Atlantic Ocean, Subtle Shifts Hint at Dramatic Dangers
The Complete Directory: U.S. Colleges & Universities is a pretty impressive interactive infographic with charts, maps, pop-ups, and more - all rendered in Tableau. And that may be the problem: Tableau is great, but I'm not sure it is suitable for such a large and complex data viz.
