- The YouTube playlist
- The Course itself as a series of Esri Story Maps linked from an ArcGIS Experience
Monday, September 21, 2026
Data, GIS, and Society Online Course
This looks interesting: The Data, GIS, and Society Online Course.

Saturday, September 19, 2026
Ice Age Animations
These are really cool: visualization of the ice sheet(s) extend(s) across Europe during the last Ice Age. Notice the rising & lowering of sea level as well and its effect on land masses!
Can someone please make this for the Laurentide Ice Sheet?
Thursday, September 17, 2026
Best Travel Weather
Here are some tools to help you decide when to travel & where as a function of the 'best' weather & climate:
Tuesday, September 15, 2026
Ice in Antarctica
We know that ice started to form in Antarctica some 34 million years ago while that did not happen in the Northern Hemisphere until about 20 million years ago - why? Elevation! GHG concentrations and thus temperatures slowly declined over the last several 10s of millions of years. At the same time, Antarctica saw tectonic uplift and at some point the rising land and falling temperatures meant that the glaciation level dropped to below the land elevation and it became possible to snow to persist year-around - cool!
Sunday, September 13, 2026
Tuesday, September 8, 2026
The Ozone Hole: Bigger Connections
Well-done Cleo! This video offers great context centered around three important dates or decision points: 1959, 1987, and 2026. Watch the last minute or whole thing:
AI & Data Viz
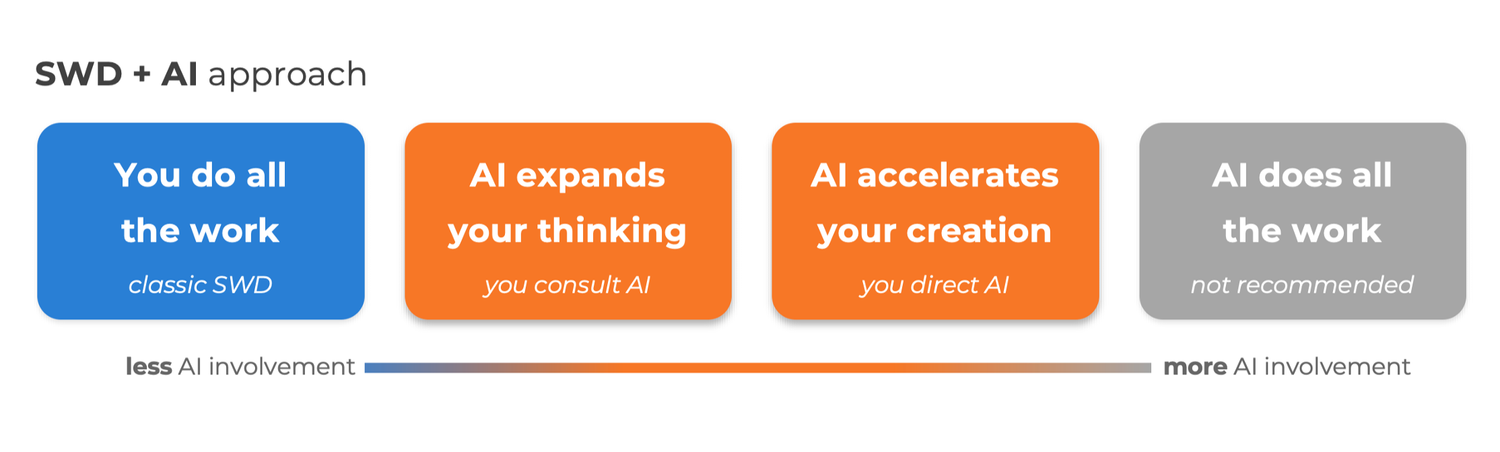
Or, to make it simpler: Making charts with AI (as opposed doing it yourself with MS Excel). Good stuff here from the folks at Storytelling With Data: https://www.storytellingwithdata.com/ai-data-storytelling
Monday, September 7, 2026
485 Million Years!
Good WP article & PBS Terra video!

- The REAL STORY of Climate Skeptics New Favorite Graph
- Scientists have captured Earth’s climate over the last 485 million years. Here’s the surprising place we stand now.
What are the take-home messages? CO2 is the main climate driver and climate change is normal. Yep, but: the climate change we are measuring today is a) much faster than anything over the last 485 million years and b) caused by humans, not by nature.
Saturday, September 5, 2026
Lean & AI
Lean is the hip thing in math these days, especially in connection with AI. That's all I know, but here's more: ‘It is incredible’: How AI is transforming mathematics
Friday, September 4, 2026
Slop Tells & LLM Cliche Highlighter
Worried that your reports, slides, talks, etc. sound 'too AI' because you used too much AI to make them? Well, now you can use more AI tools to make your work sound 'less AI'. Great.
This reminds me a little of the good old EduBabble Generator & EduBabble Bingo.
Friday, August 28, 2026
August 2026 Glacier Collapse in Nepal
Here's what happend: a section of a glacier collapsed which trigged a landslide across a river valley that damed-up the river for a while before collapsing and triggering the flood. Yes, these events happen naturally, but it seems very likely that global warming and the associated destabiliztion of glaciers and permafrost 'loaded the dice' and increases the liklhood, magnitude, and intensity of such events.
Why do we need gen-eds?
Or, perhaps the better question is this: how many gen-ed classes should be required to get a Bachelor's degree? 10% of all classes? 25% of all classes? 33% of all classes? Trust me when I say this: nobody wants to take them, teach them, or pay for them.
Why science needs the huaminties more than ever (Nature, 25 June 2026) argues the usual: STEM fields, alone, cannot offer the ethical reasoning, historical context, and cultural connecctions that are required to be an informed and responsible citizen of the world. 'Hard' technical expertise is critical but has to be complemented by 'soft' human skills.
That's fine & I don't think anyone disagrees with that. But here are the practical questions:
- Do we really need a take an array of special classes that have nothing to do with our desired profession to get these 'soft' human skills? Or, could this be infused & embedded in classes that also offer pratical professional skills?
- Let's agree that we need special gen-ed classes: how many? Currently we basically force students to take about 1/3 of all their classses in the gen-ed curriculum - that seems too much to me.
Here's my proposal: create a mandatory Minor that all students need to take that consists of 6 classes or 18 credits: 1 science class with a lab, 1 math class, 1 writing class, and three more classes in the arts, humanities, and social sciences.
Tuesday, August 25, 2026
Hawaii & The Jetstream
Fun graphics, data, and map here: Every nonstop to Hawaii, and what the wind costs you
Obviously it takes longer to fly west than to fly east in the mid-latitudes because of the the prevailing winds & this website does a nice job of demonstrating this without any fancy animations.
Monday, August 24, 2026
SLR Map
Nothing new here, but a nice interface & an option for an image export - nice! The steps are 2 m, 10 m, 30 m, and 70 m - would be nice to offer more options such as 1/3/5 meters and/or specific ones, especially for the West Antarctic Ice Sheet. Explore here: Simulate Coastlines After Sea Level Rise
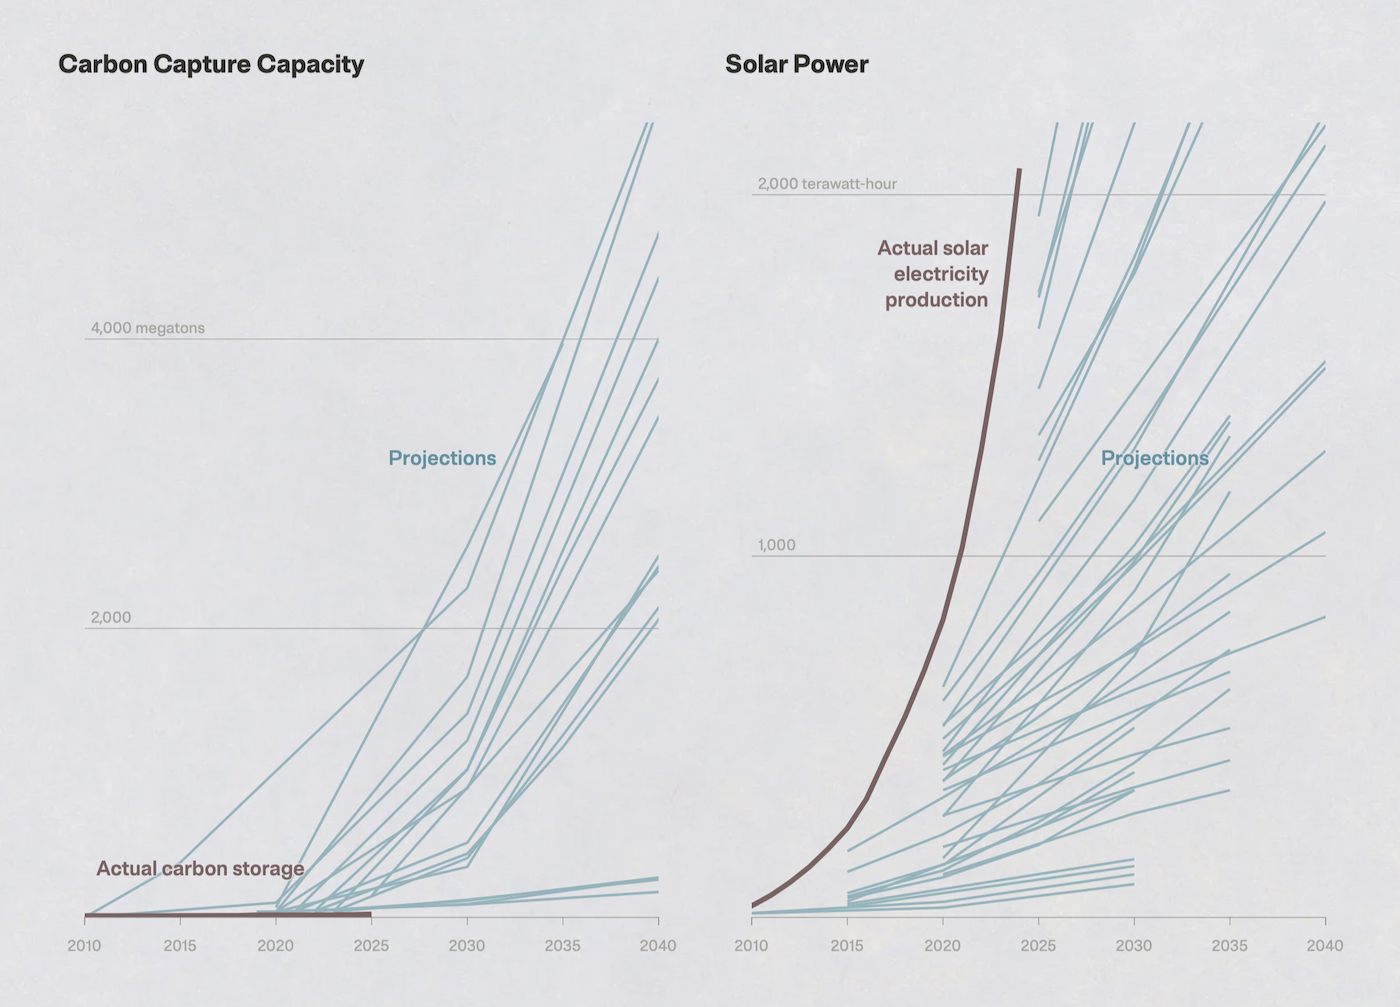
CCS will NOT work!
But, solar & wind will! More @ https://projects.propublica.org/why-carbon-capture-cant-solve-climate-change/. The chart below is from Flowing Data:
Sunday, August 23, 2026
3D Undergound
Who knew: there is a website / service called DrillerDB that compiles all US well logs (something like 23 million) and also offers a 3D underground visuzalization based on these well logs. It's a little glitchy and I'm not sure about the accurcay & consistency of these data, but it would match the known regional geology prety well I would assume:
Try it here: https://drillerdb.com/underground and read more about it on Maps Mania.
Tuesday, July 14, 2026
Flow Maps
Flow Maps are cool, but really tricky to actually design & make look good. Here are two good resources:
- Flow Maps (by Esri) shows some hacks in ArcGIS Pro & ArcGIS Online that can be used to make flow maps.
- Flow Mapping (by PennState) is a great overview & introduction.
Friday, July 3, 2026
National Parks: Crowds & Climate
This is a very cool analysis: what's the best time of the year to visit a given US national park if you want to balance crowds & weather? Sure, there are hardly any crowds in Glacier National Park in January, but you are in the middle of winter. Likewise, J-Tree is pretty empty in July, but can you deal with the heat?
Explore it all here: How to See the Most Popular US National Parks, Without the Crowds
An American Mosaic
Coool interactive web map by the NYT: An American Mosaic
There is an article to go along, but that's behind the NYT paywall.
Subscribe to:
Posts (Atom)