An Extremely Detailed Map of the 2024 Election by the NYT shows the 2024 election results down to the precint level & the data are available as well!
Thursday, January 23, 2025

The Copernicus Interactive Climate Atlas
The Copernicus Interactive Climate Atlas is awesome - have a look! You can display measurements, reanalysis, and model data at all kinds of geographies & time scales. And: download the data in a bunch of formats.
It is just too much...nobody will use it. Expert scientists will access the data directly and the general public will scared off by the complexity. This is really designed for the rare 'regular' person who is interested & competent enough to figure-out the tool.
Suggestion: Make a simplified version or walk-through video.
Tourism & AI
Cool combination of tourism & AI: Google Talking Tours. Here Google combines Street View images & panoramas with an AI-generated narrative. Currently this only covers some 55 major sites, but you can easily envison this for literally anywhere.
SAR 'Images' in ArcGIS Pro
Good stuff here in-case you need to process SAR imagery in ArcGIS Pro: Getting to Know the SAR Analysis Toolset.
Saturday, December 21, 2024
Let's Eat!
America’s Chain and Independent Restaurants maps out all restaurents across the USA coded by their degree of 'chainness' from the 310,000 or so single-location restaurants to the 24,333 Subways. Now if they only would make the underlying restauranr address data available!
More @ https://friendlycities.gatech.edu/data-interactive/

The Global Wind Atlas
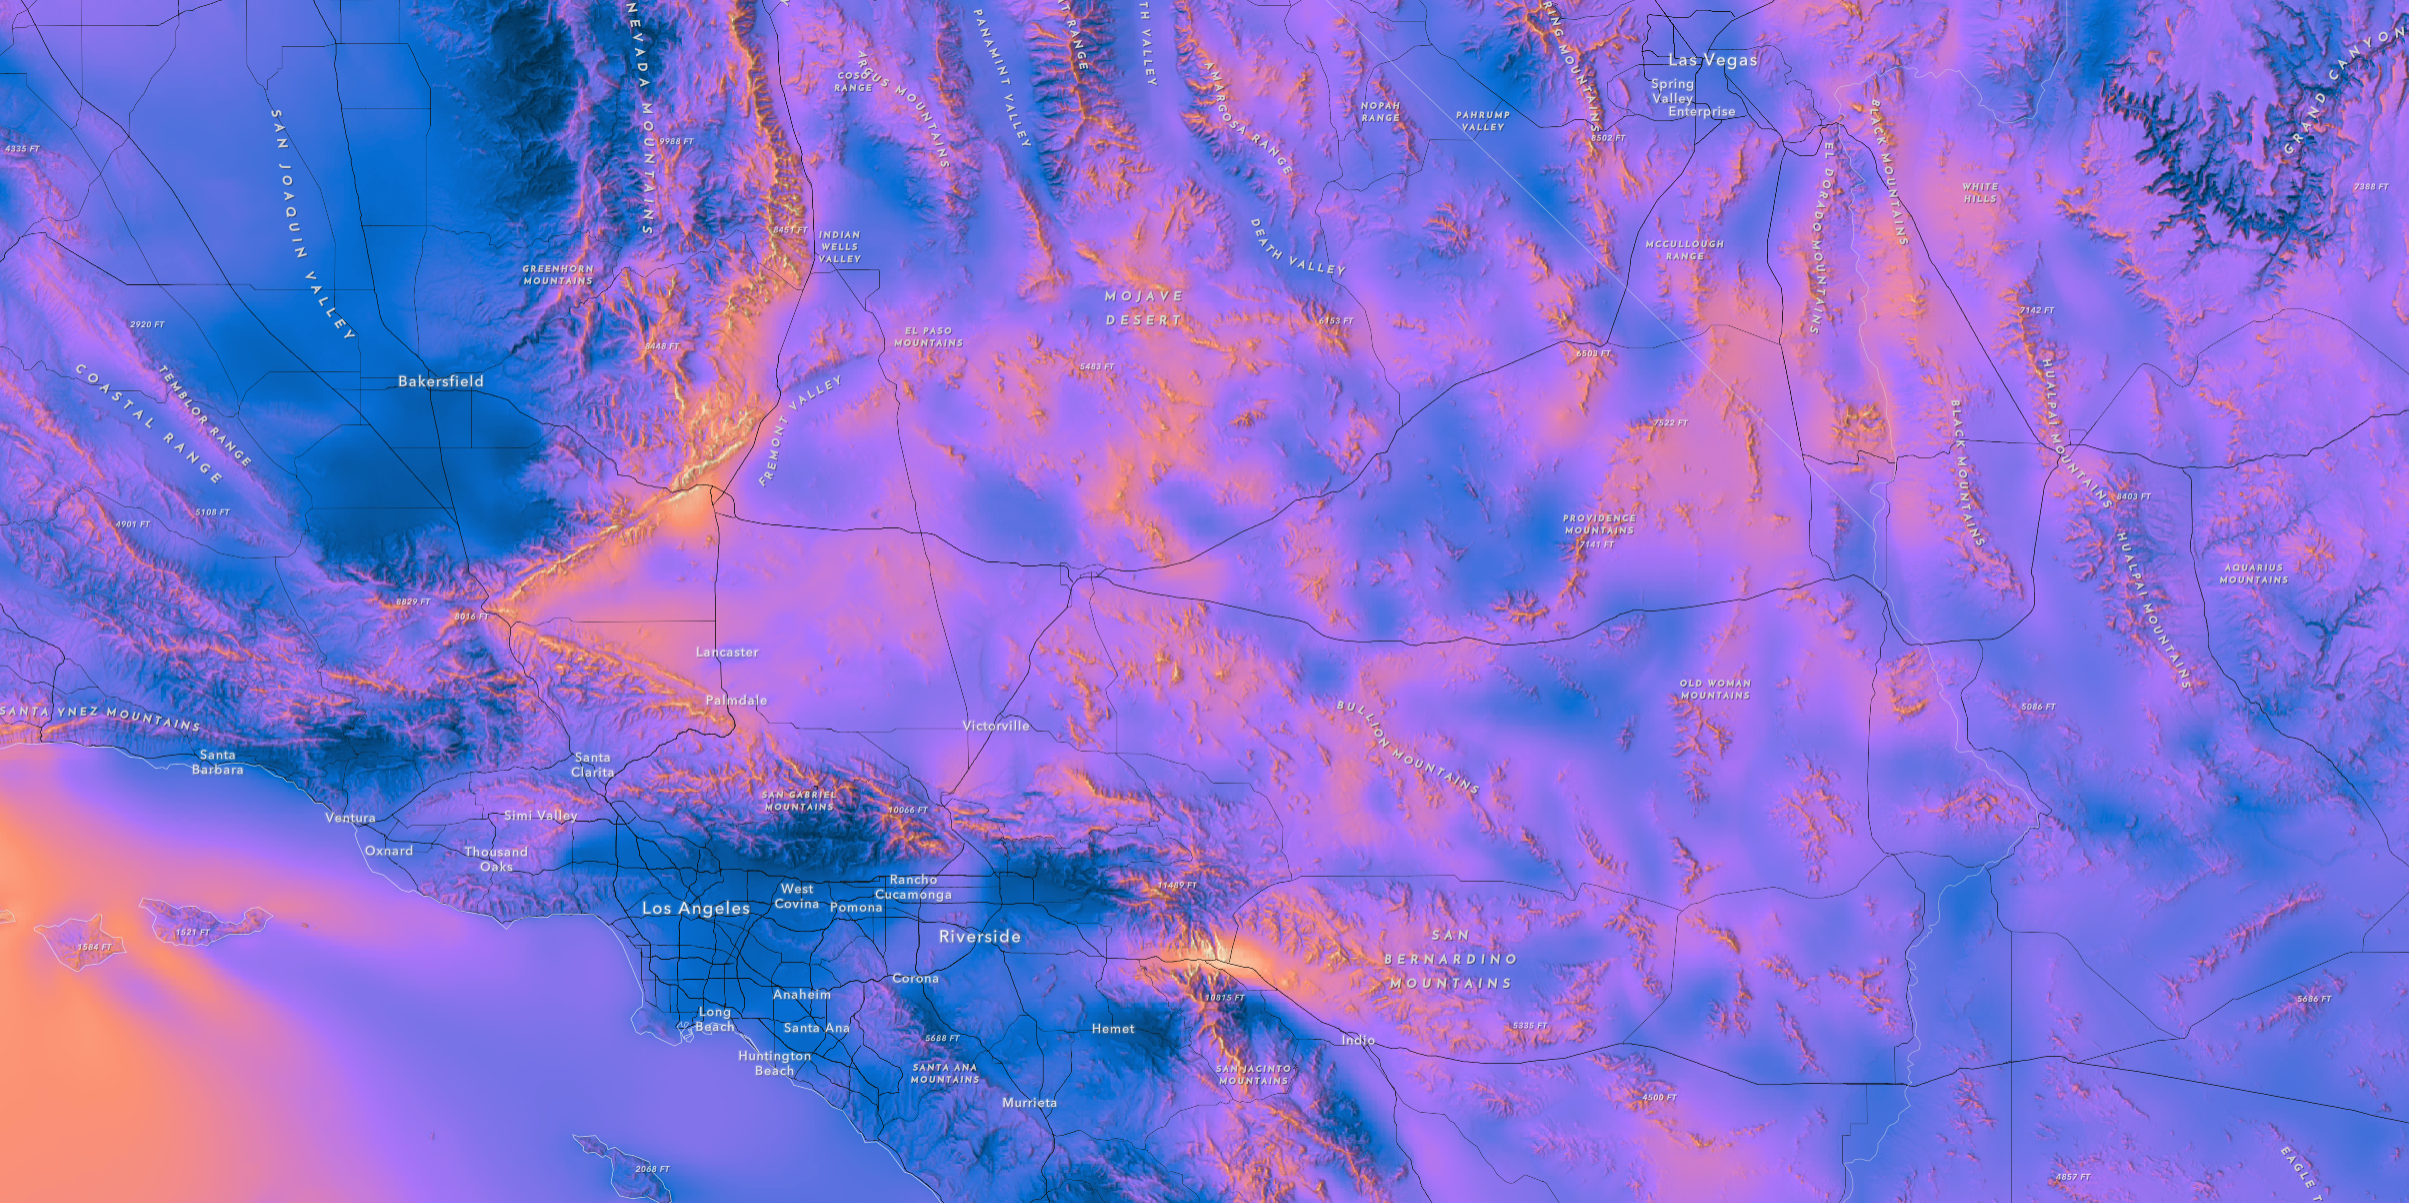
Here are three new data layers & Esri Story Map (complete with a Suitabiliy Analysis) about wind around the world: https://arcg.is/uG9yC1
Friday, December 20, 2024
The Coldest Day of the Year
Nice ArcGIS Online Web App (by NOAA): Coldest day of the year across the United States
The spatial pattern is interesting:
- The western parts of the USA reaches its climatological coldest day in December (matching the seasonal cycle of insolation). because of the moderating influence of the Pacific Ocean (clouds, precipitation, etc.).
- The eastern parts of the USA (especially New England) reaches its seasonal minimum in later January because of the influence of cold air masses from Canada and the presense of snow cover that reflects solar radiation.
- Noticeable 'cold pockets' in the Rockies, Casades, and Sierra Nevada represent locations in deeper valleys with frequent temperature inversions.
Subscribe to:
Posts (Atom)