Wednesday, July 22, 2020


Monday, July 20, 2020
Thursday, July 16, 2020
Chart Chooser / Chart Types
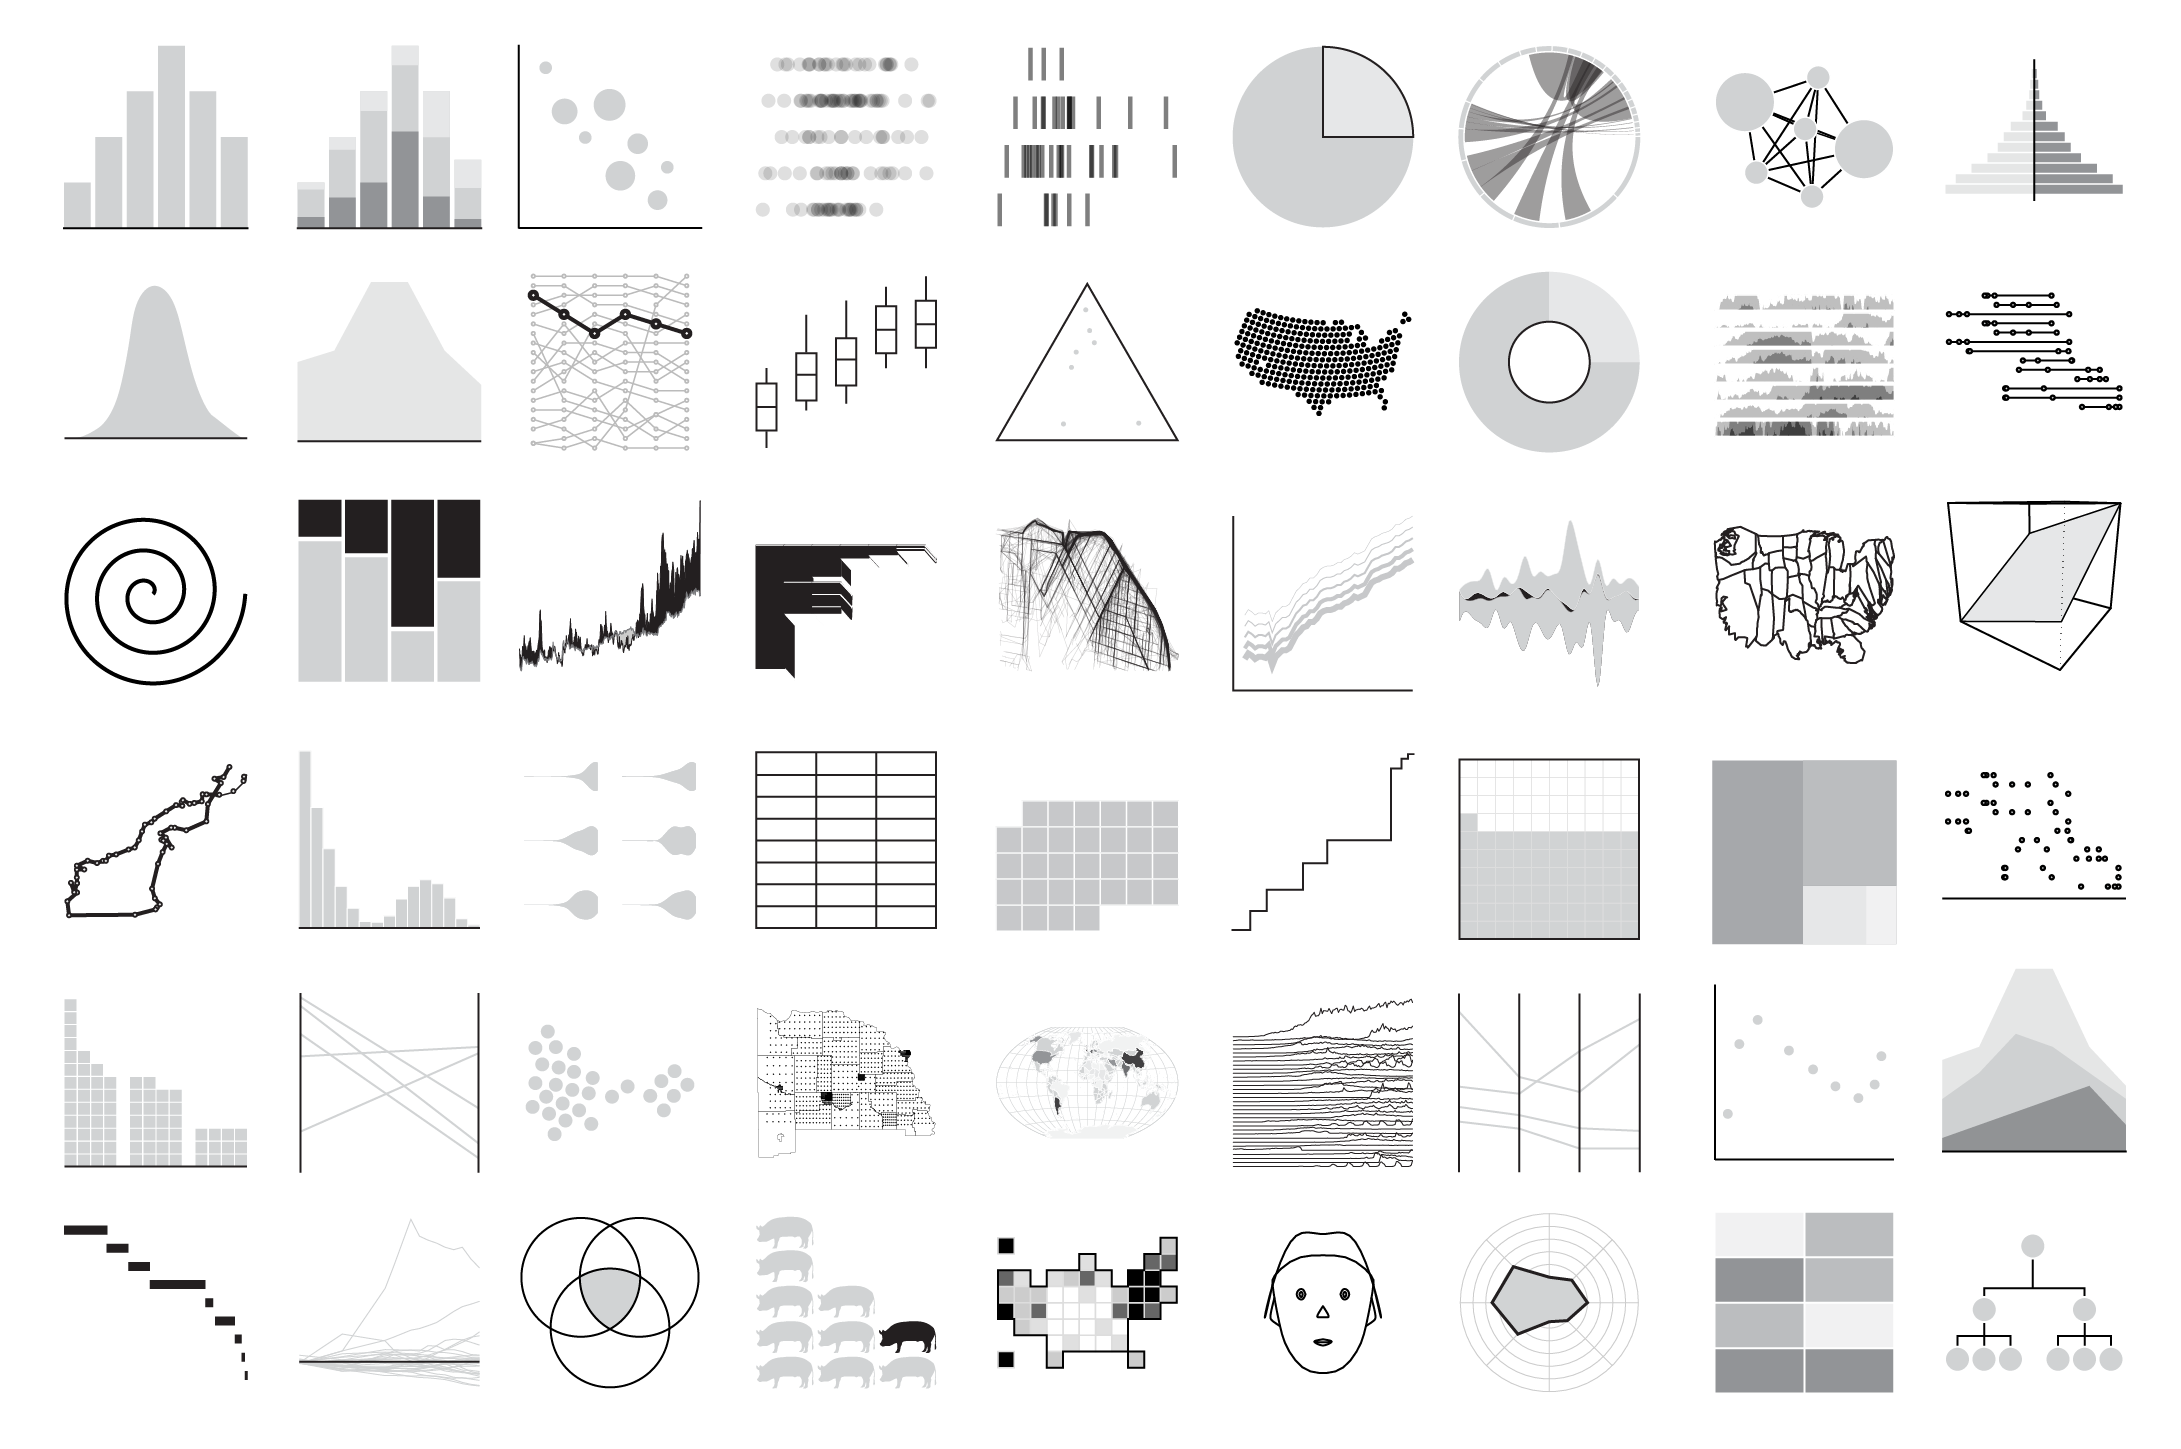
FlowingData cataloged all the chart types - not really a chart chooser, but a nice way to find information and resources about specific chart types: Cataloging All the Charts
Flooding
Two great interactive data viz related to flooding:

- How is flooding affecting your community? gives all kinds of cool embedded maps comparing flood risk in 2020, 2035, and 2050. Many you can embed in your website or create an animated GIF (see below).
- Flood Factor is simple: just enter your address and see your flood risk.

Land Cover: Yesterday, Today, and Tomorrow
And - finally - here is a nice compilation of land cover data as part of Esri's Living Atlas of the World:
- 1992 - 2018 (measured)
- 2050 (predicted)
The SDGs Today
Nice website (sponsored by Esri): The SDGs Today @ http://sdgstoday.org/. Here you can see and download the data related to the 17 SDGs.
Related to that: Esri also compiled the ArcGIS Living Atlas Indicators of the Planet (same basic idea).
Related to that: Esri also compiled the ArcGIS Living Atlas Indicators of the Planet (same basic idea).
Subscribe to:
Posts (Atom)