Wednesday, July 15, 2020

Monday, July 13, 2020
Risky Business!
I'm not an expert, but I think I would put 'going to school' somewhere in the orange zone of this chart. For context, here's the xkcd version: https://xkcd.com/2333/
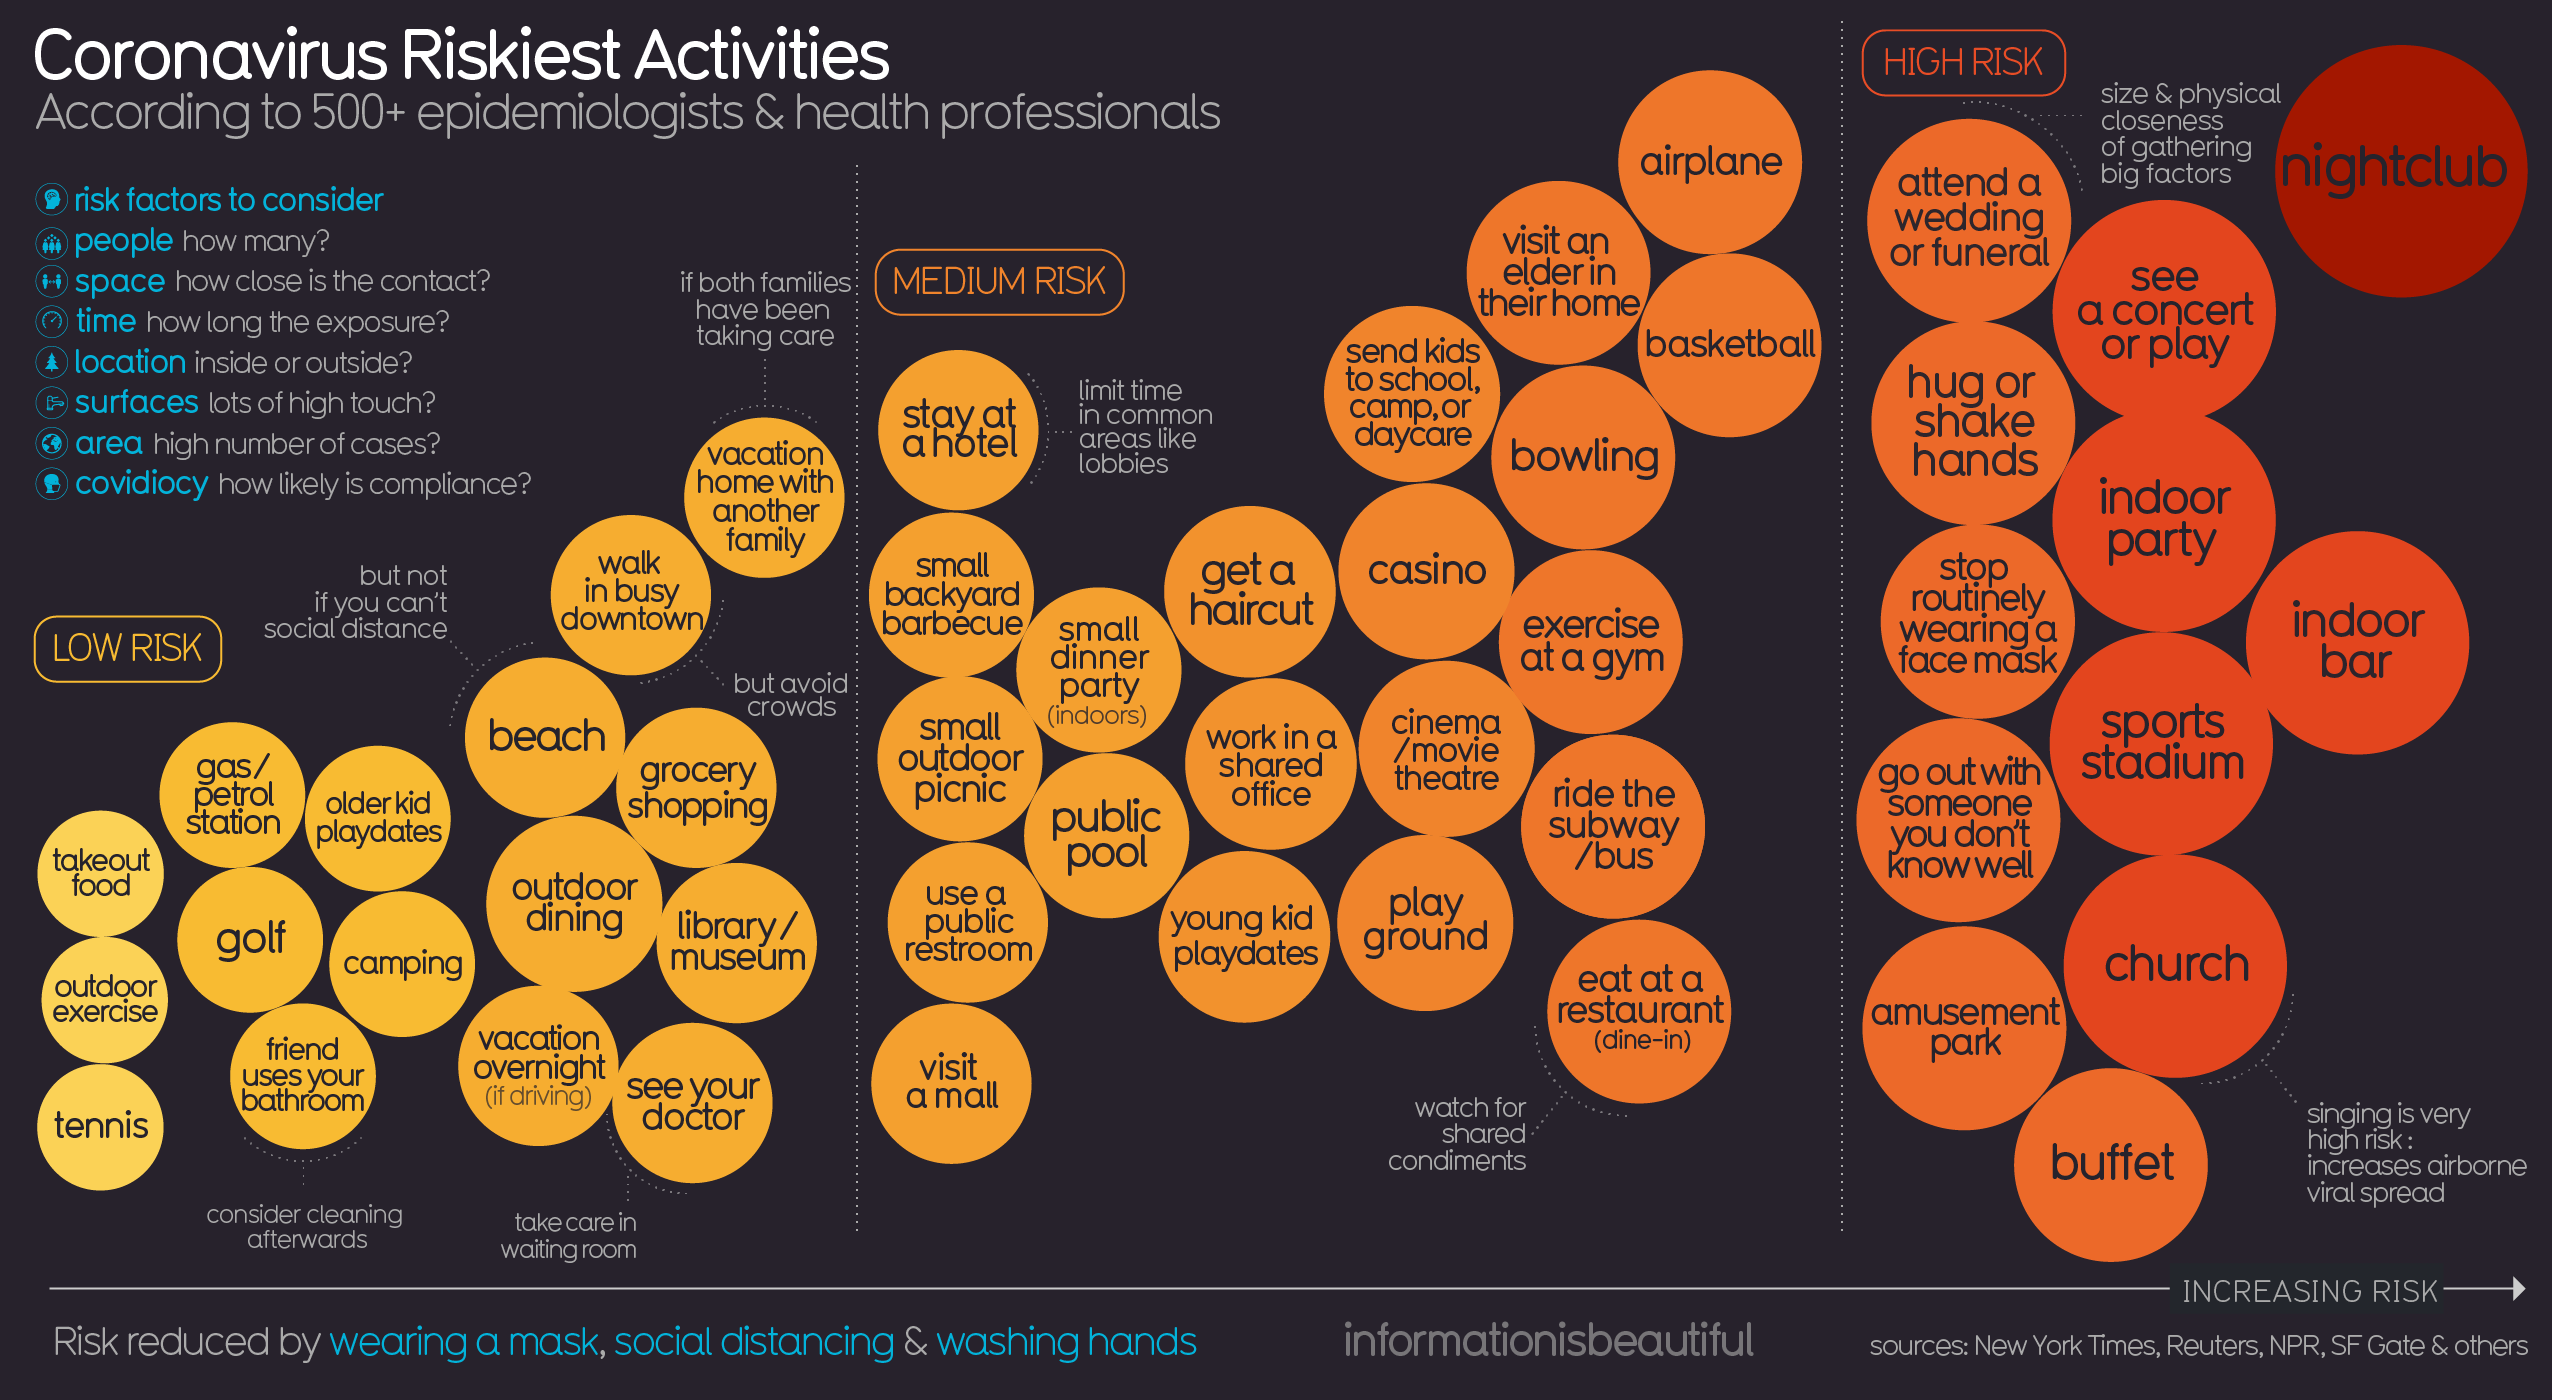 |
| https://informationisbeautiful.net/ |
Saturday, July 11, 2020
Wishful Thinking vs Science
This is pretty good, especially the COVID-19 section starting ~2:00-minutes.
Anti-Racism Pedagogy
This is not my expertise, but here are some useful resources:
- Robin DiAngelo: How 'white fragility' supports racism and how whites can stop it. At the end of this interview she gives white people five specific tasks.
- Take the 21-Day Racial Equity Habit Building Challenge
- Read the Me and White Supremacy Workbook
- Why White Students Need Multicultural and Social Justice Education
Geography Games
Seen on Maps Mania: How Well Do You Know the World?
Honestly, Guess Where? is just dumb and not useful in any way: recognizing a capital city based on a Google Maps close-up is just silly and has nothing to do with geographic knowledge or insights. This is in-essence the 21st-century version of memorizing river names and has nothing to do with what we think of as the 'geographic perspective'. At least show the satellite image and scale bar - that way you can begin to use deductive reasoning and practice 'thinking like a geographer'.
Honestly, Guess Where? is just dumb and not useful in any way: recognizing a capital city based on a Google Maps close-up is just silly and has nothing to do with geographic knowledge or insights. This is in-essence the 21st-century version of memorizing river names and has nothing to do with what we think of as the 'geographic perspective'. At least show the satellite image and scale bar - that way you can begin to use deductive reasoning and practice 'thinking like a geographer'.
Friday, July 10, 2020
Boston's Black Heritage Trail
Boston's Black Heritage Trail is a really nice 'story map', created in Tableau.
But, I'm torn. On one hand it shows-off what you can do with Tableau in terms of geography-based mapping and data viz, but on the other hand this would look so much better, especially on smartphones, using a tool such as Esri Story Maps that is specifically-designed for such a purpose.
But, I'm torn. On one hand it shows-off what you can do with Tableau in terms of geography-based mapping and data viz, but on the other hand this would look so much better, especially on smartphones, using a tool such as Esri Story Maps that is specifically-designed for such a purpose.
21 Arguments
It's not that complicated: The 21 best arguments for wearing a mask
 |
| https://www.lavision.de/en/news/2020/4302/ |
Subscribe to:
Posts (Atom)