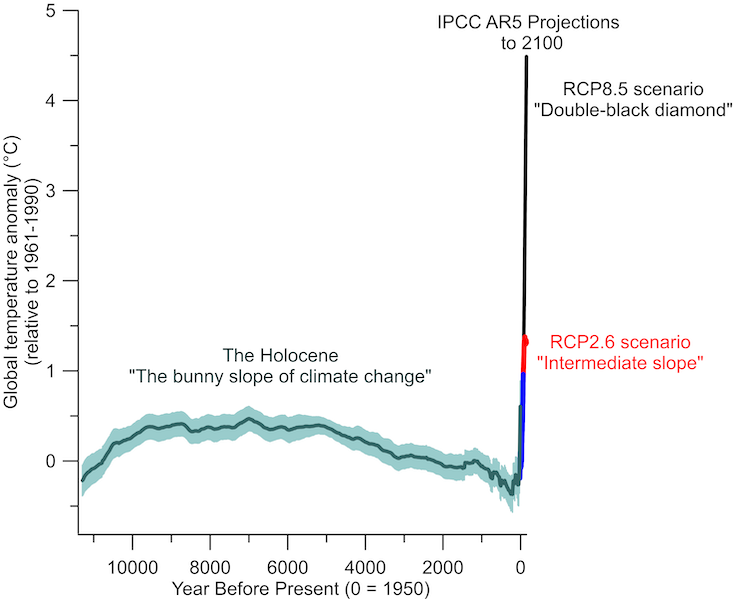
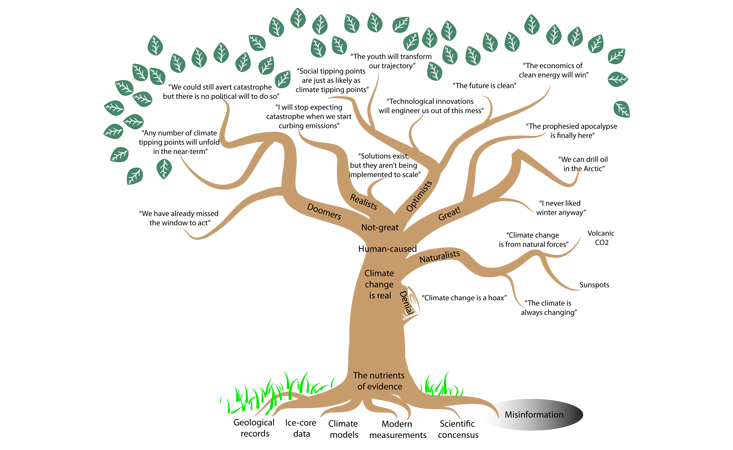
The Climate Learning Tree (by Summer Praetorius) is a good read and includes two nice figures (see below).
Sunday, January 5, 2020
Saturday, January 4, 2020
NCSE Climate Change Lesson Plans
The six NCSE Climate Change Lesson Plans look pretty good and can be adapted easily to different grade-levels.
The 2019 Global Multidimensional Poverty Index (MPI)
The 2019 Global Multidimensional Poverty Index (MPI) is a great data set to map using a GIS.
Ecoregions: North America and Global
Ecoregions of North America and Global as simple interactive maps:
Friday, January 3, 2020
Urban Sprawl
Great analysis from The Upshot (NYT): A Decade of Urban Transformation, Seen From Above. This includes the map below and some great examples showing urban sprawl using satellite images. Too bad these are not available as animated GIFs!
Thursday, January 2, 2020
Poverty By County
Powered by Microsoft Power BI: Poverty by State and County. Nothing new here - basic ACS data that have been visualized many times before and better...
Subscribe to:
Posts (Atom)