Saturday, October 14, 2017
Minard and Napoleon
Here's a great interactive overlay of Minard's map combined with a matching interactive chart: Minard and Napoleon

Friday, October 13, 2017
Santa Rosa: Before and After
This is incredible: Santa Rosa: Before and After - try http://bit.ly/2hDEccy to see an image comparison.
Thursday, October 12, 2017
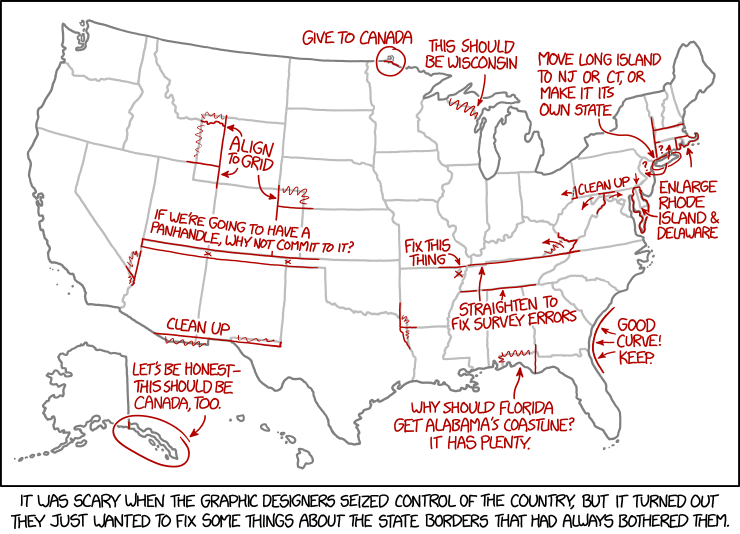
Gerrymandering
Found on FlowingData: Changing the Math on Gerrymandering (brilliant illustrations) and District - A Game about Representation & Redistricting.
Mapped: How the US generates electricity
Mapped: How the US generates electricity (by CarbonBrief) is a nice interactive map, zoomable to different states. This would go well with The Solutions Project and their 100 percent renewable energy portfolios for the different states.
Then there is the North American Power Plants map with a nice feature: it updates the summary legend as you zoom-in, zoom-out, or pan.
Then there is the North American Power Plants map with a nice feature: it updates the summary legend as you zoom-in, zoom-out, or pan.
Friday, October 6, 2017

Wednesday, October 4, 2017
Get Started with Story Maps
Get Started with Story Maps is a nice 2-hour introduction to Esri Story Maps, including the Story Map Tour, the Story Map Cascade, and the Story Map Journal.
Subscribe to:
Posts (Atom)