Tuesday, September 19, 2017
StorylineJS
StorylineJS looks great - a simple way to create an annotated and interactive chart (just point to your data in Google Sheets).

Kilauea: Fountains of Fire
Kilauea: Fountains of Fire is a pretty neat Esri Story Map and the creator explains the process of making here at The Making of Kilauea: Fountains of Fire. Here's a pretty cool animated GIF:
 |
| https://blogs.esri.com/esri/arcgis/2017/09/13/the-making-of-kilauea-fountains-of-fire/ |
Wednesday, September 13, 2017
Rising Seas
Here we have a web map with the actual sea level measurement station data: Rising Seas. This shows the actual measured values, not predicted ones say for the 21st century.
Tuesday, September 12, 2017
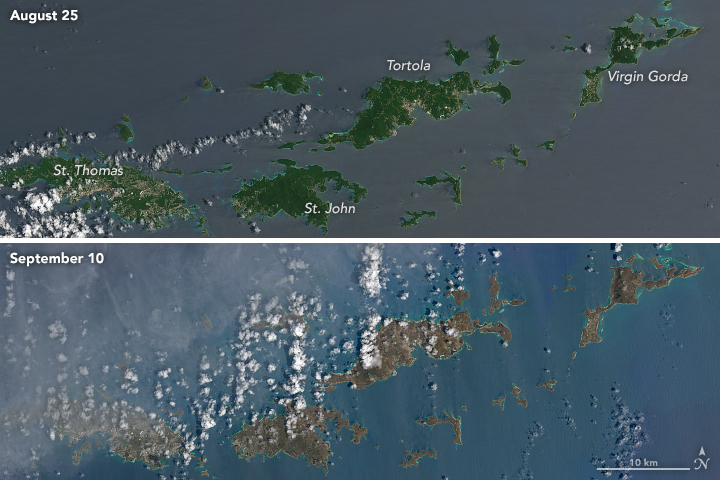
Irma and the Islands
Pretty impressive images of the Caribbean Islands before and after Irma:
 |
| https://earthobservatory.nasa.gov/IOTD/view.php?id=90952&src=iotdrss |
Saturday, September 9, 2017
Subscribe to:
Posts (Atom)