Tuesday, August 20, 2013
Airports: delays and weather
This is nicely done: a web-based visualization showing airport delays (as map and table) and airport weather - all updated periodically by the FAA.

StreetMix
Design your own neighborhood street - complete with trees, bike paths, or bus lanes! Save your design and share it with others: a great tool to explore options of what-could-be.


One Dot per Person!
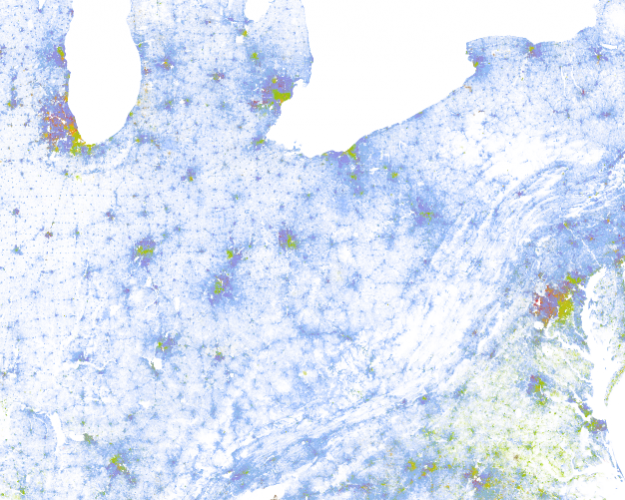
Here are several maps of the USA where each person is presented with a single dot - cool!

- 2010 Census Dot Map
- 2010 Census Racial Dot Map (Google version)
- 2010 Census Racial Dot Map (Leaflet.Js and OSM version)
- Simplified version from the New York Times
- Dot Map for England and Wales
For more information about these dot maps, and additional maps, see FlowingData.
Change Matters!
Esri is now providing free online access to Landsat imagery - very nice! Of course, the Landsat images have been public for a while now via the USGS, but this image service makes it easy and efficient to integrate them into ArcGIS projects (desktop or online) - at least for basic mapping and display purposes. Real quantitative satellite image analysis will still require the underlying multi-spectral images and the dedicated software packages.
Maps as Art
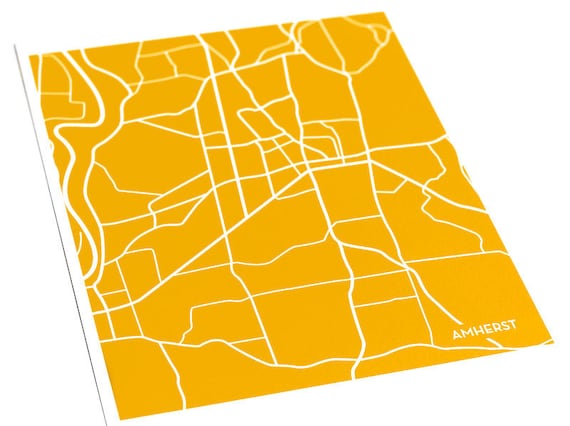
Choose your city, color, and size - makes for a nice holiday present: Custom city maps for the modern home.
 |
| Amherst (MA) |
R
Nothing new here: R has been a popular statistical analysis software for many years now. Now Google has released a nice 21-part series of short videos that introduce the basic functions of R (great for teaching!).
- R
- R Video Series (by Google)
- Better charts in R (Nathan Yau)
Subscribe to:
Posts (Atom)