The Global Building Atlas is cool, but most people (and especially my students) cannot handle a GitHub respository. But, thanks to Maps Mania, we now have a convenient downloader into GeoJSON: The Global Building Atlas Downloader. Thanks!
Friday, December 19, 2025
Times New Roman vs Calibri
This argument is old and the facts are clear, but of course this is back in news recently with the State Department switching back to Times New Roman because Calibri is too woke for them.
The NYT has a nice article: Is Times New Roman Better Than Calibri for the State Department?
Personally, I have been using Calibri for my slidedecks for a long time: it is simple, looks good, and is easy to read. But...maybe a little boring. For text I prefer Garamond - I think it looks elegant & sophisticated. But...Arial is Google Docs default & thus most of my text is now in Arial.
The Top-20 Programming Languages
Here's the latest TIOBE index: https://www.tiobe.com/tiobe-index/
- Learn Python, it's that simple!
- Or, one of the many versions of C!
- Don't bother with any of the other!
Sunday, December 14, 2025
AI chatbots can effectively sway voters – in either direction
AI chatbots can effectively sway voters – in either direction & that sounds scary. The article in Nature is better, but behind a paywall: AI chatbots can sway voters with remarkable ease — is it time to worry?
And why are we surprised? An engaging back-and-forth conversation with a nice 'person' that can synthesize a lot of information in conversational way has always been a great way to learn and maybe change your mind. The challange was scaling this.
How can we leverage this for teaching & learning? If chatbots are so effective, why are we not using them in-class or as homework assignments: Have a 10-minute chatbot chat about Topic X & synthesize the main points handwritten on this piece of paper.
Saturday, December 13, 2025
Urban Mobility: CAVs
Good article here about how CAVs (connected autonmous vehicles) can be integrated into new urban mobility systems within 'smart' cities. Yes, a lot of techo buzzwords here, but worth a read.


The Future of GIS?
Well, it was just a matter of time!
- The Web Mapper (powered by AI)
- The Map Doctor (powered by AI)
Saturday, December 6, 2025
USA Surficial Geology
Verty cool new map from the USGS: Cooperative National Geologic Map: Earth's Surface geology (ArcGIS Online). Or, get it from the USGS.


Thursday, December 4, 2025
Losing the Climate Info Wars?
Good stuff here: Losing the Climate Info Wars?
"The strategy is not subtle, a recent study found. Climate skeptics present their position as “projecting rationality, authority, and masculine self-control” while those who acknowledge global warming “are depicted through emotionally charged, feminized, and irrational imagery,” and labeled “alarmists” who propose radical solutions.
Political campaigns deploy the same playbook. Republicans frequently claimed the Biden administration was trying to “emasculate” American drivers by forcing them into electric vehicles. Lee Zeldin, Mr. Trump’s Environmental Protection Agency administrator, has labeled climate change a “religion” instead of what it is: a matter of physics.
Taylor Rogers, a White House spokeswoman, said that Mr. Trump was pursuing “energy addition, not energy transition.”
“The President has set a strong example for the rest of the world by reversing course on the Green Energy Scam and unleashing our natural resources, like beautiful, clean coal and natural gas, to strengthen our grid stability and lower energy costs,” she said, citing arguments that many economists dispute."
Wednesday, December 3, 2025
Glaciers in the Andes
Here are three excellent videos about glacier recession & disappearance in the Andes:
Tuesday, December 2, 2025
No More GDP!
Great article in Nature by Constanza et al.: Beyond growth — why we need to agree on an alternative to GDP now
Here's the summary: GDP was never designed as a metric for human well-being. It kind of worked as a proxy for that for a couple of decades after WWII, but no more. Using GDP assumes substitutability between labor, technology, and natural resources in the context of production. But this obviously ignores ecological limits or planetary boundaries, or, in other words: it decouples economic activity from natural resource use.
We need instead to adopt a universal goal: sustainabilty & inclusive well-being. Not sure why inclusive well-being is separated from sustainabilty here, but ok. The question then is how do we a) measure that and b) how do we aggreate our metrics into some kind of index or proxy? Here are some of the metrics: Well-being components: these 19 core factors are common to most beyond-GDP indicators.
Human
- Life satisfaction
- Health
- Life expectancy at birth
- Education
Social
- Crime
- Civic engagement
- Governance
- Income equality
- Gender equality
Built
- Housing
- Infrastructure
- Financial security
- Employment
- Per capita consumption
- Business health
Natural
- Natural capital
- Water quality
- Air quality
- Greenhouse-gas emissions
Sounds a lot like donut economics to me!
The Cost Of Living
Excellent data set & web map from the Economic Policy Institute: The Family Budget Map. This map shows (by county) the cost-of-living for a 'normal' two-parent, two-child family broken down into housing, food, child care, transportation, health care, taxes, and other necessities.
Even better: the data are accessible as MS Excel!
Friday, November 28, 2025
Our Demographic Future
In the 20 century: the demographic transition theory.
Here, countries transitioned from high fertility/mortality to low fertility/mortality due to modernization and development such as female empowerment, access to health care, and more.
Today: most countries are past this transition and in many countries fertility has fallen below replacement levels (which is about two children / woman). This applies to about 5.8 billion people and include countries such as Brazil, India, China, and more - these countries are already experiencing population decline. Fertility is still very high in sub-Saharan Africa & this will drive global population growth for many more decades.
Now, the main factors in population dynamics are a) migration and b) longevity. This means that in high-income countries immigration is and will be the main driver of population growth & that is ultimately what is behind the rise of MAGA & other types of nationalism / populism that we see.
Plus the so-called second demographic transition that is playing out in wealthy countries: fewer children = lower fertility due to rising individualism, new models of partnerships, and gender equality.
More details @ https://www.science.org/doi/10.1126/science.aed1652
Thursday, November 20, 2025
Tuesday, November 18, 2025
Landsat Surface Temperature
This seems cool, but I have no idea what to do with it: Landsat Surface Temperature Web Mapping Application and Data. Joe Kerski has some ideas here.
The Periodic Table Of Data Viz
Pretty cool, but uesless: https://www.visual-literacy.org/periodic_table/periodic_table.html
Sunday, November 16, 2025
We Are Fluffed!
Here's some reading for Bill Gates:
"We are hurtling toward climate chaos. The planet's vital signs are flashing red. The consequences of human-driven alterations of the climate are no longer future threats but are here now. This unfolding emergency stems from failed foresight, political inaction, unsustainable economic systems, and misinformation. Almost every corner of the biosphere is reeling from intensifying heat, storms, floods, droughts, or fires. The window to prevent the worst outcomes is rapidly closing."
"Climate change mitigation strategies are available, cost effective, and urgently needed. From forest protection and renewables to plant-rich diets, we can still limit warming if we act boldly and quickly. Social tipping points can drive rapid change. Even small, sustained nonviolent movements can shift public norms and policy, highlighting a vital path forward amid political gridlock and ecological crisis. There is a need for systems change that links individual technical approaches with broader societal transformation, governance, policies, and social movements."
Saturday, November 15, 2025
The Future Of AI
Cool piece in Nature: The Future of AI
Nature spoke to six people at the forefront of AI development — people who are driving the technology’s development and adoption, and those who are preparing society to adapt to its rapid rise. In this video series, they describe their greatest ambitions for the technology, their expectations of where and how it will be adopted in the coming years, and their concerns for the future.
The usual caveats apply: selection bias, who signs their paychecks, etc.
Tuesday, November 11, 2025
Bills Gate's Climate Memo
So, everybody is going crazy over Bill Gate's recent 'memo': A warmer world will hurt this group more than any other
Read the details yourself, but Gates basically presents the classic mitigation vs adaptation strawman argument that goes something like this: "For most people, the greatest problems are poverty and disease, not climate change and therefore we should focus on those, not climate change."
Ok, Bill: let's talk:
- That's just a false dicotomy - we can & should focus on both.
- Climate change is a threat and harm amplifier.
- The greatest impacts of climate change today & in the future will happen in the poorest countries.
- A 2.5 - 3 C warmer world will be radiacally different from our world today.
Mike Mann has a nice World View piece in Nature: Bill Gates’s climate comments are a dangerous distraction. Mike starts with the classic Stephen Schneider statement: when it comes to climate change, the "end of the world" and "good for you" are the "two lowest-probability outcomes". Read the rest!
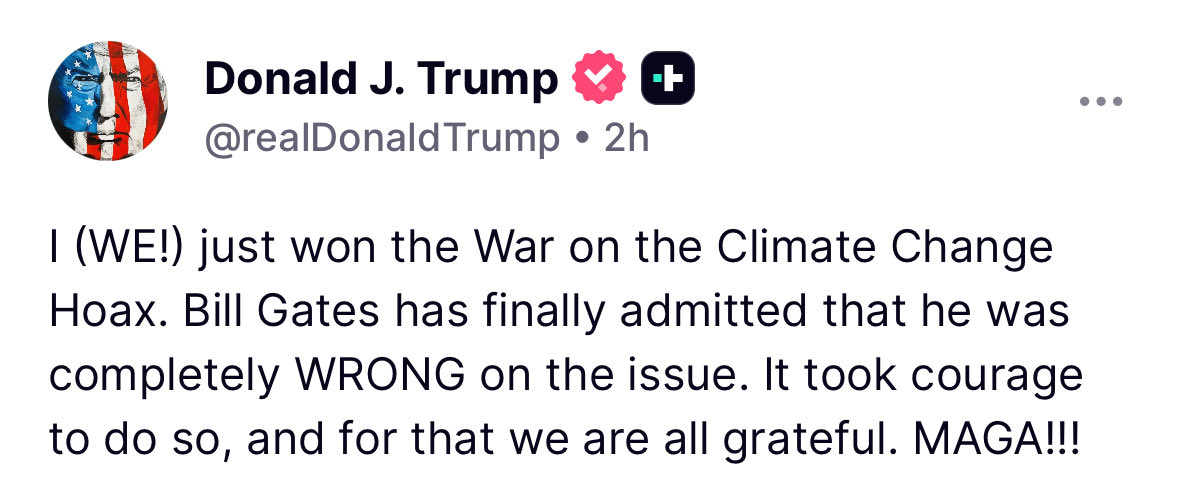
Predictably, climate deniers jumped on this & claimed that Bill now supports them in rejecting the climate change hoax: “I (WE) just won the war on the climate change hoax.Bill Gates has finally admitted that he was completely WRONG on the issue. It took courage to do so, and for that we are all grateful. MAGA!!!”
The questions is: why...why spend your time & resources on this 'memo'?
Friday, November 7, 2025
The Romans Google Maps!
This is really cool: a high-resolution digital map allows people to plan their routes along the ancient roads of the Roman Empire.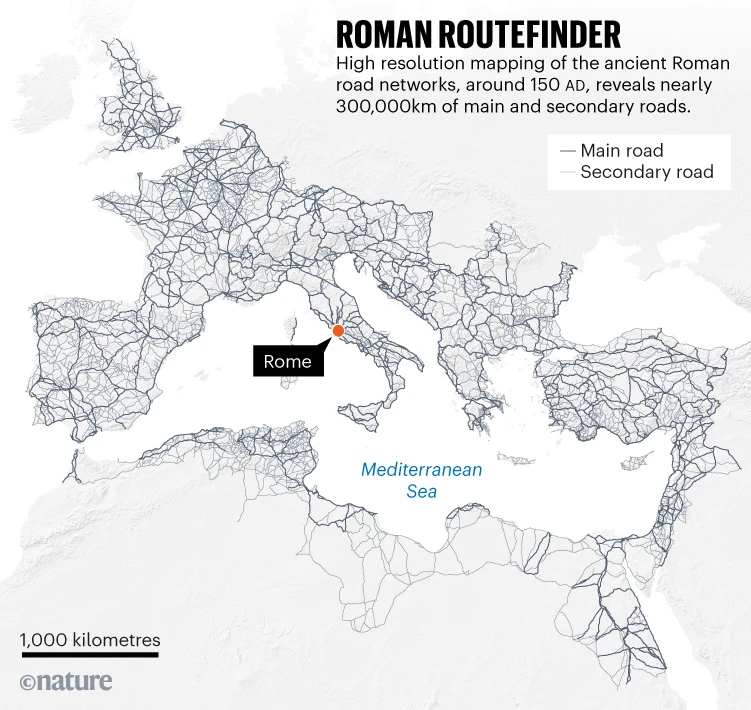
- Summary in Nature
- De Soto, P., Pažout, A.,Brughmans, T. et al. (2025) Itiner-e: a high-resolution dataset of roads of the Roman Empire. Nature Scientific Data. https://doi.org/10.1038/s41597-025-06140-z
- https://itiner-e.org/
Thursday, November 6, 2025
Mega Screenshots
Excellent hack to 'trick' your browser & create super high-resolution screenshots: How to Get Giant Screenshots from a Browser
Tuesday, November 4, 2025
ToolUniverse
ToolUniverse is a unified ecosystem that transforms any large language model (LLM)—open or closed—into a powerful AI scientist. By standardizing how LLMs identify and call tools, it integrates over 600 scientific resources, including machine learning models, datasets, APIs, and analysis packages.
With its AI-Tool Interaction Protocol, ToolUniverse provides a common interface for seamless communication between LLMs and tools, ensuring compatibility across platforms such as GPT, Claude, Gemini, and open-source models.
More over here: ToolUniverse Documentation
3D model of Sutro Tower in San Francisco
This is super-slick: https://vincentwoo.com/3d/sutro_tower/

Tuesday, October 21, 2025

Saturday, October 18, 2025
Skiing & GHG Emissions
The glaciers are melting. Are ski resorts digging their own graves? is focused on Europe, but the same story is likely playing out across the USA. Of course, nobody who can afford to go skiing would have a train/bus from London to Annecy or Boston to North Conway - that's just going to happen.
Monday, October 13, 2025
Drowning Cities in 3D
Via Maps Mania: Sea Level Rise 3D Map is cool, but takes forever to load on a normal PC with a normal Internet connection.
Thursday, October 9, 2025
Sora: When Tik Tok Meets AI
From the App Store: Turn your ideas into videos and drop yourself into the action. Sora is a new kind of creative app that turns text prompts and images into hyperreal videos with sound using the latest advancements from OpenAI. A single sentence can unfold into a cinematic scene, an anime short, or remix of a friend's video. If you can write it, you can see it, remix it, and share it. Turn your words into worlds with Sora.
Sounds great? Sounds horrifying? Try Sora 2 here: https://openai.com/index/sora-2/
Is this the end of 'creativity' on Tik Tok? Well, maybe? But: could you use something like that for teaching & learning: maybe as a new way to 'write' as opposed to a traditional paper or slidedeck presentation?

Tuesday, October 7, 2025
Reimaging The University
No lectures, exams, essays: inside a twenty-first-century university is a terrible article about NMITE, a super-elite engineering college in the UK. Nothing of what they are doing is innovative at all - they can pull it of because they have 110 students and 50 staff and one degree: engineering. Good for them & their private funding, but none of this is scalable to public higher education. This article would have benefited from more context & nucance: as-is it reads like a NMITE press release or advert.
The Backsliders
This looks like a timely book: The Backsliders: Why Leaders Undermine Their Own Democracies.
'Backsliding' refers to a strategy to erode democracy gradually by using some of its existing systems and structures. Complementary to that is 'trash-talking democracy' where a leader erodes the trust in democratic institutions by claiming over & over that they are corrupt & incompetent.
Sunday, October 5, 2025
Google Alpha Earth
Google Alpha Earth is a new geospatial AI model that acts as a virtual satellite: it assimilates all kinds of geospatial data & does the processing for you. Then, you just ask & get ready-to-use AI-generated 'maps' of whatever you want. No more working with dozens of raw datasets!
Example: glacier mapping. In thed old days you would have spent considerable time finding useful cloud-free images, do some kind of processing, and then run some kind of index or band-ratio calculations. Now you can just ask: give me the size of the Humboldt Glacier over the last 10 years.
For now the focus seems to be on physical data collected by sensors, but I would assume that human data from will be included in the future.
More here: AlphaEarth Foundations helps map our planet in unprecedented detail
The End of GIS: AI!
The AI Revolution is Coming for GIS: What You Need to Know About Microsoft’s Latest Warning is a pretty dire read...but you probably should add 5-10 years to this timeline. Here are a few take-home messages for me:
- The impact will be most-significant on the entry-level jobs.
- But, field work and basic project management will still be around for a while.
- Coding is still a key skill, but it will be all about AI-assisted coding in the very near future. But, you will need to have a good understanding of coding and how AI 'thinks' in-order to effectively prompt the AI.
- Take an online class in maschine learning for geospatial applications.
- Combine GIS expertise with complementary skills such as urban planning, environmental science, and more.
Thursday, October 2, 2025
PaintMyMap
From the website: PaintMyMap.com is an online custom map maker that lets you create, style, and export beautiful maps in minutes. Choose a world, continent, or country map—or upload your own data (GeoJSON, TopoJSON, Shapefiles, KML, CSV)—then paint regions, add labels and a legend, and export a high‑quality image or PDF.
Might be useful?
Tuesday, September 30, 2025
Historical Aerial Photos
Remember when air photos were a thing? Well, they still are! This place https://e-topo.com/mapv2.aspx offers the low-res 300 dpi versions for free somehow.
Are Rooftop Solar Panels the Solution to America's ...
This looks great, but unfortunately behind the NYT paywall: https://www.nytimes.com/interactive/2025/09/27/business/energy-environment/rooftop-solar-panels.html
Saturday, September 27, 2025
Climate Trace
Incredible data & visualization from Climate TRACE!
- Track Global Emission of air pollution.
- Pollution Plumes shows how they disperse from point sources.
Nerd Alert: Python, The Documentary!
Read more about it here: Python, the movie! The programming language’s origin story comes to the silver screen. Then watch it!
The future of universities
The future of universities is an excllent special in Nature. The focus is obviously on 'typical' universities and not the 'job mills' that are typical of public higher education in the USA such as state universities or community colleges.
Friday, September 19, 2025
How people are using ChatGPT
How people are using ChatGPT is a quick web article from OpenAI that summarizes the findings from a working paper entitled How People Use ChatGPT. The key figure is below.


The Electrotech Revolution
The Electrotech Revolution is a good read & a great slide deck - here are the three take-home bullet points:
- Physics: Electrotech makes the energy system more efficient. Electrotech is around three times more efficient than fossil fuel systems, which waste two-thirds of primary energy inputs (380 exajoules) as heat at a cost of $5 trillion every year. Solar and electrification enable us to harness the power of the sun, which gives access to 100 times as much energy as fossil fuels.
- Economics: Electrotech gets cheaper as it scales. Fossil fuel commodities get more expensive as extraction continues, and their prices are elevated by major producers controlling the supply. Electrotech is manufactured and modular, resulting in clear technology learning curves, with costs falling by around 20% every time deployment doubles. Electotech is already capturing two-thirds of global energy investment and is responsible for all the expected growth in energy jobs. Electrotech contributed 10% of global GDP growth in 2023, including 22% in China, 5% in India, 30% in the EU and 7% in the US.
- Geopolitics: Electrotech enhances independence and security. 80% of the world lives in fossil fuel importing countries, with over 50 countries importing more than half their primary energy as fossil fuels. In contrast, 92% of countries have renewables potential over ten times their current demand. Replacing imported fossil fuels using three key levers—EVs, heat pumps and renewables—can cut net fossil fuel imports by 70%, saving $1.3 trillion globally each year. Once electrotech is bought, it lasts for decades, providing insulation from the vagaries of global pricing. When fossil flows stop, the economy stops. When electrotech flows stop, only growth is at risk.

Sunday, September 14, 2025
Charlie Kirk: Climate Denial & More
In case you missed it: find Charlie Kirk quotes @ https://zeteo.com/p/charlie-kirk-in-his-own-words.
Saturday, September 13, 2025
The Nature-Positive Movement
This looks like a great book: Becoming Nature Positive: Transitioning to a Safe and Just Future and here's the review in Nature: How to build nature back better — read this manual
The idea is that it is insufficient to just reduce environmental harm or become sustainable, but rather to regenerate nature in an active way = become nature-positive. This would be the opposite to the standare greenwashing that we see all over.
Here's an interesting angle mentioned in the review:
- Purpose-led businesses (e.g. Patagonia, etc.) can pursue ambitious goals & lead by example.
- Smaller companies can be agile and influence their local communities.
- Large companies have a) the resources and b) the scale throughout their entire supply that even small improvements can have a large aggregate impact.
Related: Rengerative Agriculture. I'm not a farmer, but these all seems like no-brainers: plant cover crops, rotating crops, reduc tilling, and integrate trees all to a) prevent soil erosion and b) improve the soil. Read more about here: A revolution is sweeping Europe’s farms: can it save agriculture?
Friday, September 12, 2025
The Correct Map
Notthing really new here, but a few nice resources:
- The Correct World Map
- The “correct” map
- A cool scrolly-type story map: The true size of Africa
- The Equal Earth Projection
TLDR? Here's the short version: It is mathematically impossible to transform the surface of a sphere on a 2D surface without distorting at-least one of these properties: 1) angles, 2) shapes, and 3) distances. These distortions are minor at large-scales (e.g. neighborhoods or cities), but considerable at small-scales (e.g. countries, continents, or wolrd). Catographic projections need to balance these distortions in-order to make the map as useful as possible for its intended purpose. Therefore, there is no such thing as a 'correct' map: every map is wrong, but there are well-established cartographic projections that are most-suitable for certain applications.

Saturday, September 6, 2025
How To Make Animated GIFs
Great video: How to Make Dataviz GIFs (4 Steps with Free Software)
- Assemble the frames as slides in MS PPT.
- Save each frame as an image (use JPG as it creates a white background).
- Upload the JPGs to a free GIF website (e.g. Ezgif).
- Share the animated GIF!
Or, make it natively in MS PPT = save as animated GIF! But this does not allow you to adjust the timings between the frames and transitions.
Friday, September 5, 2025
Pickleball vs. Tennis
Pickleball wins...it's not even close: How Pickleball Took Over Thousands of Tennis Courts, as Seen From the Sky

Saturday, August 30, 2025
The Cooperative National Geologic Map
The Cooperative National Geologic Map is cool, but what happened half-way across PA: no more data?
Friday, August 29, 2025
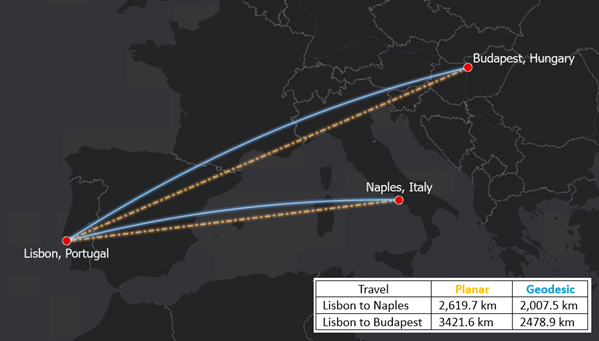
Projections & Distances
Geodesic or planar: which to use for distance analysis (by Esri) is a nice overview of the issue. Take-home message: use geodesic distances!
Thursday, August 28, 2025
Forms in ArcGIS Online & Beyond!
Nice summary & overview here: Comprehensive Guide to Forms in ArcGIS Online
- Basically you can use Forms within ArcGIS Online / Map Viewer to edit feature layers (digitize new features, input/edit attribute data, etc.).
- And: you can use Forms for field data collection using ArcGIS Field Maps.
Tuesday, August 26, 2025
Sketchfab & Cannon Mountain
Sketchfab looks fun & calls itself "The leading platform for 3D & AR on the web". The free plan may be enough to get you started, but anything after that is $15 / month.
Here's an example: Cannon Mountain (New Hampshire)
Monday, August 25, 2025
GIS Certificate @ CCSU
Looks like they are running a 3-course GIS Certificate:
- Beyond the Map: Advanced GIS in Action
- GIS Advanced Certificate course
- GIS Essentials Certificate - Course 1 Fundamentals
They seem to have an Introduction to GIS & an Advanced GIS course - not sure what the 3rd course required course this.
Back in the days: a Bachelor's degree was 120 credits, the Gen-Eds were 40 credits, the Major was 40 credits, the Electives were 40 credits, a Minor was 18 credits, a Certificate was 12 credits, and 1 full-semester course was 3 credits. Yes, there were some variations, but that's about what you could expect a normal public college or university.
Now the trend is towards 90 credits for the Bachelor's degree (completed in 3 years), Minors with 15 credits, and Certifciates with 9 credits.
Thursday, August 21, 2025
AI For Science
Which AI model is best for scientific questions? Ai2SciArena offers a way to test & compare AI models in this context. And the results? See below!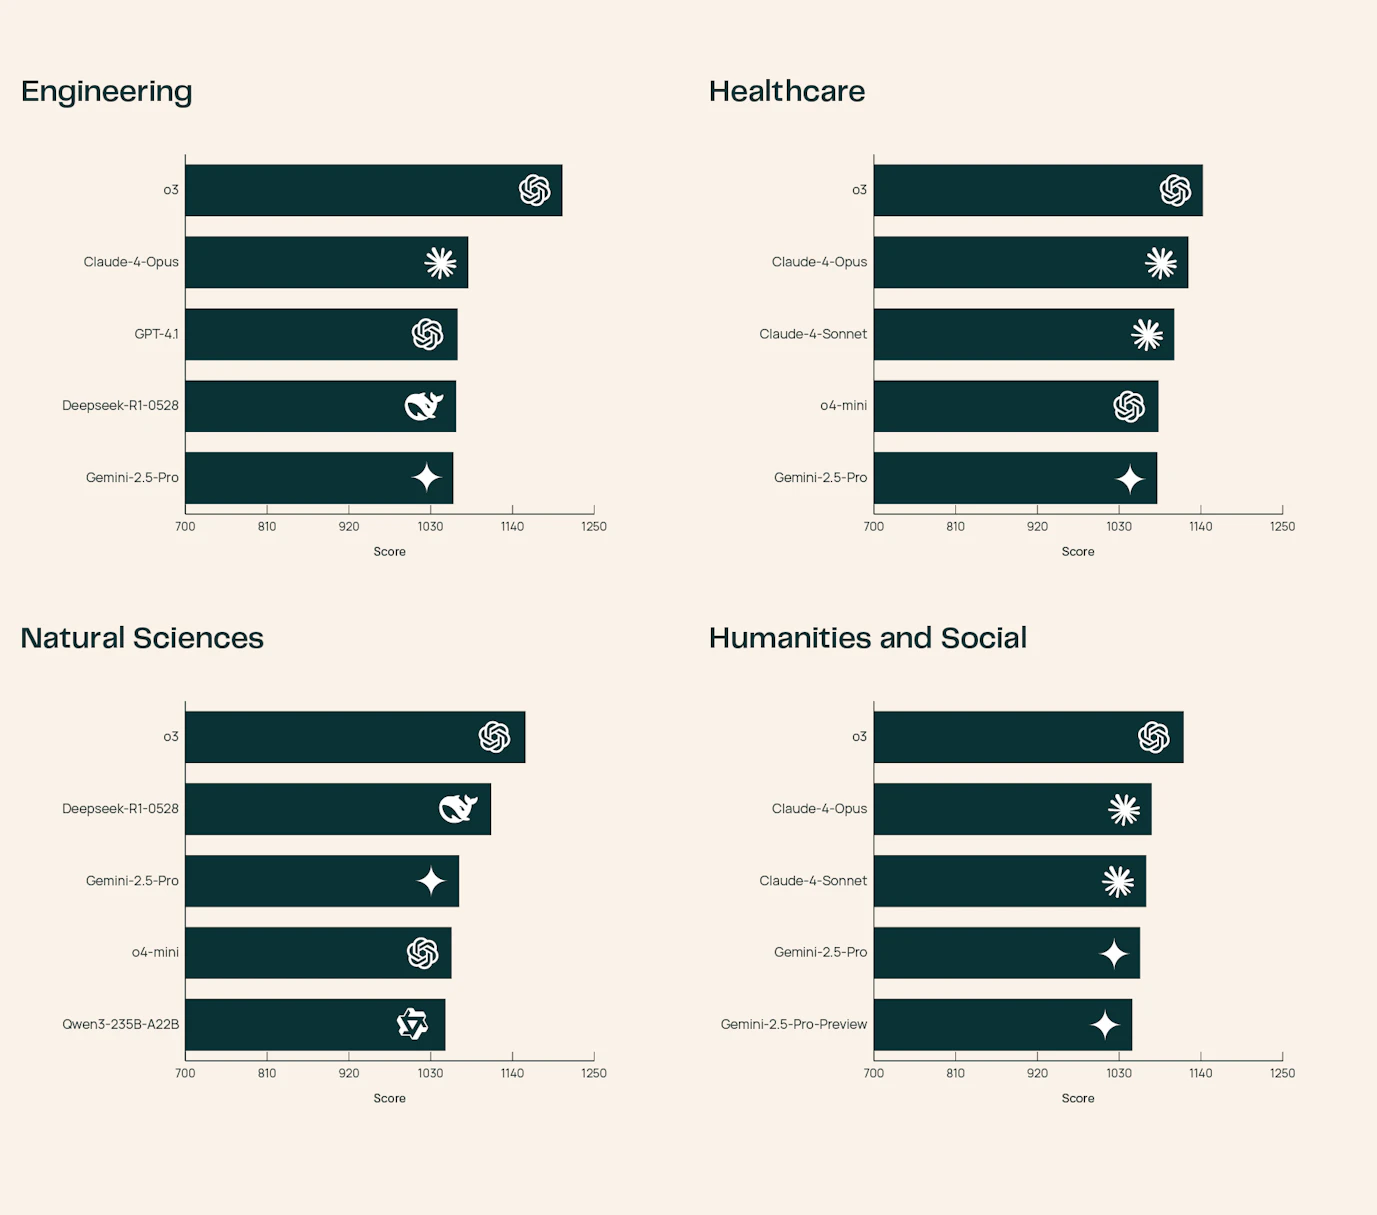
- Try it here: Ai2SciArena
- More Information
- Nature, 10 July 2025
Academia = Rotten!
Says Sabine: Things are not looking good for the future of science publishing. Researchers are leveraging AI, paper mills are churning out more fake papers than ever, and people are constantly coming up with new strategies to abuse the peer review system. Let’s take a look at how the world of science publishing is struggling with the growing issue of science fraud.
I disagree...this video & her message sound like clear examples of cherry-picking & confirmation bias to me. Plus: physicists always know everything better than anyone else...
Sunday, August 17, 2025
Carl Sagan (1995)
“I have a foreboding of an America in my children’s or grandchildren’s time — when the United States is a service and information economy; when nearly all the manufacturing industries have slipped away to other countries; when awesome technological powers are in the hands of a very few, and no one representing the public interest can even grasp the issues; when the people have lost the ability to set their own agendas or knowledgeably question those in authority; when, clutching our crystals and nervously consulting our horoscopes, our critical faculties in decline, unable to distinguish between what feels good and what’s true, we slide, almost without noticing, back into superstition and darkness…”
More @ https://en.wikipedia.org/wiki/The_Demon-Haunted_World
Wednesday, August 13, 2025
Tuesday, August 12, 2025
Fair Point!
Maybe the explanation as to why young people are not engaged & instead escape into the fantasy worlds of video games, consumption, sports, and social media is just that easy?
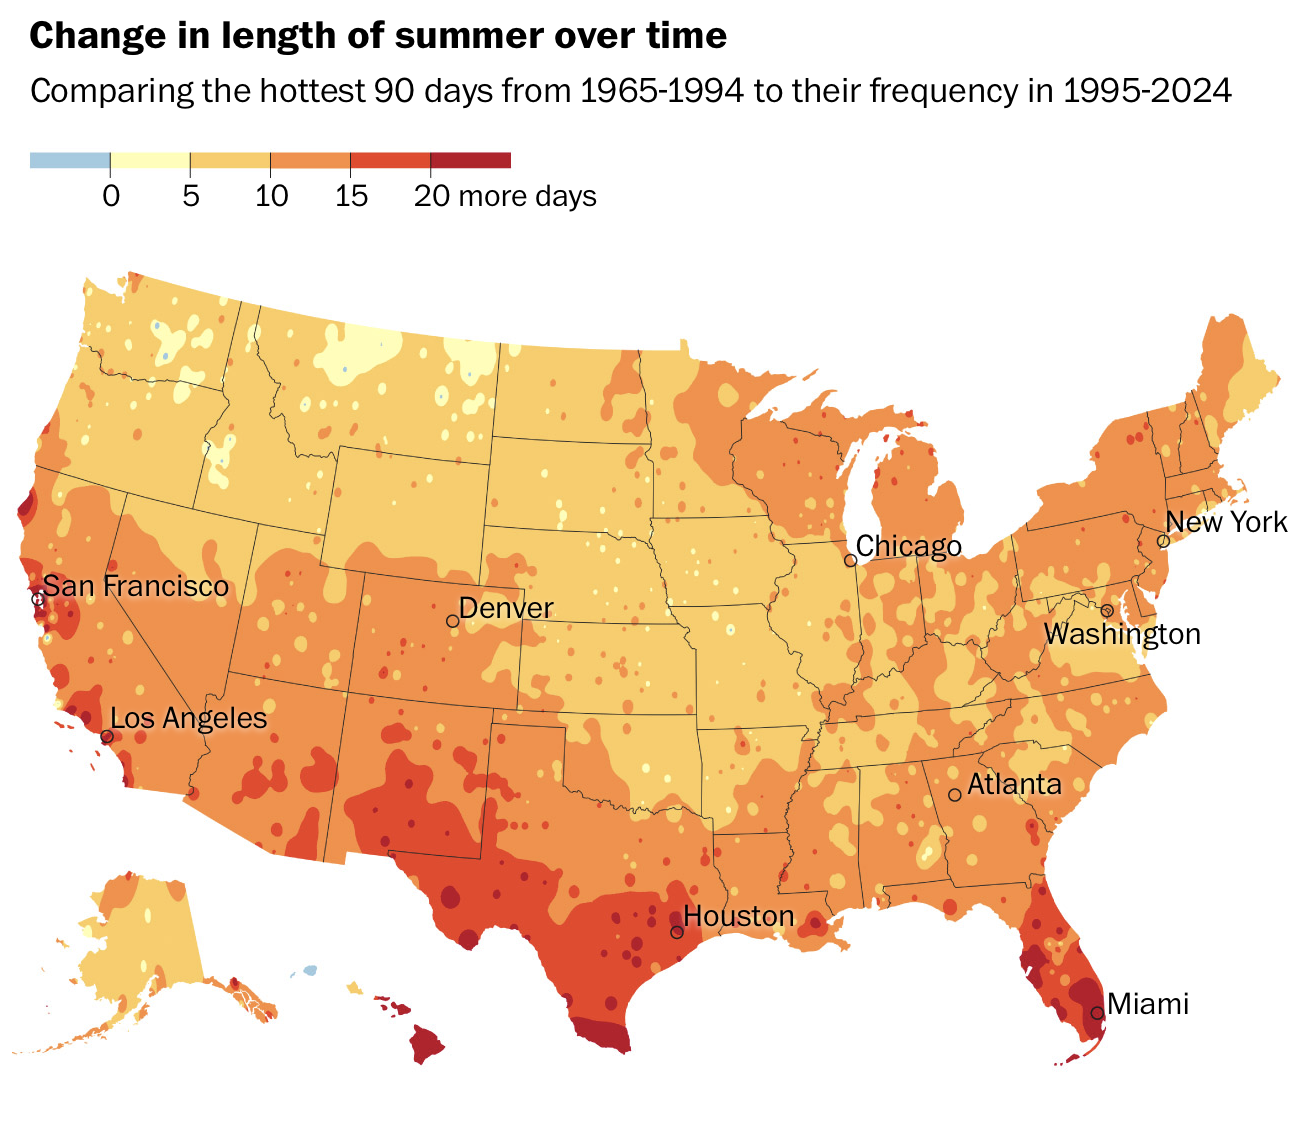
Future Climate Projections & The Living Atlas
Good information here: New Authoritative Climate Projections for the United States. Here are the data sets directly:
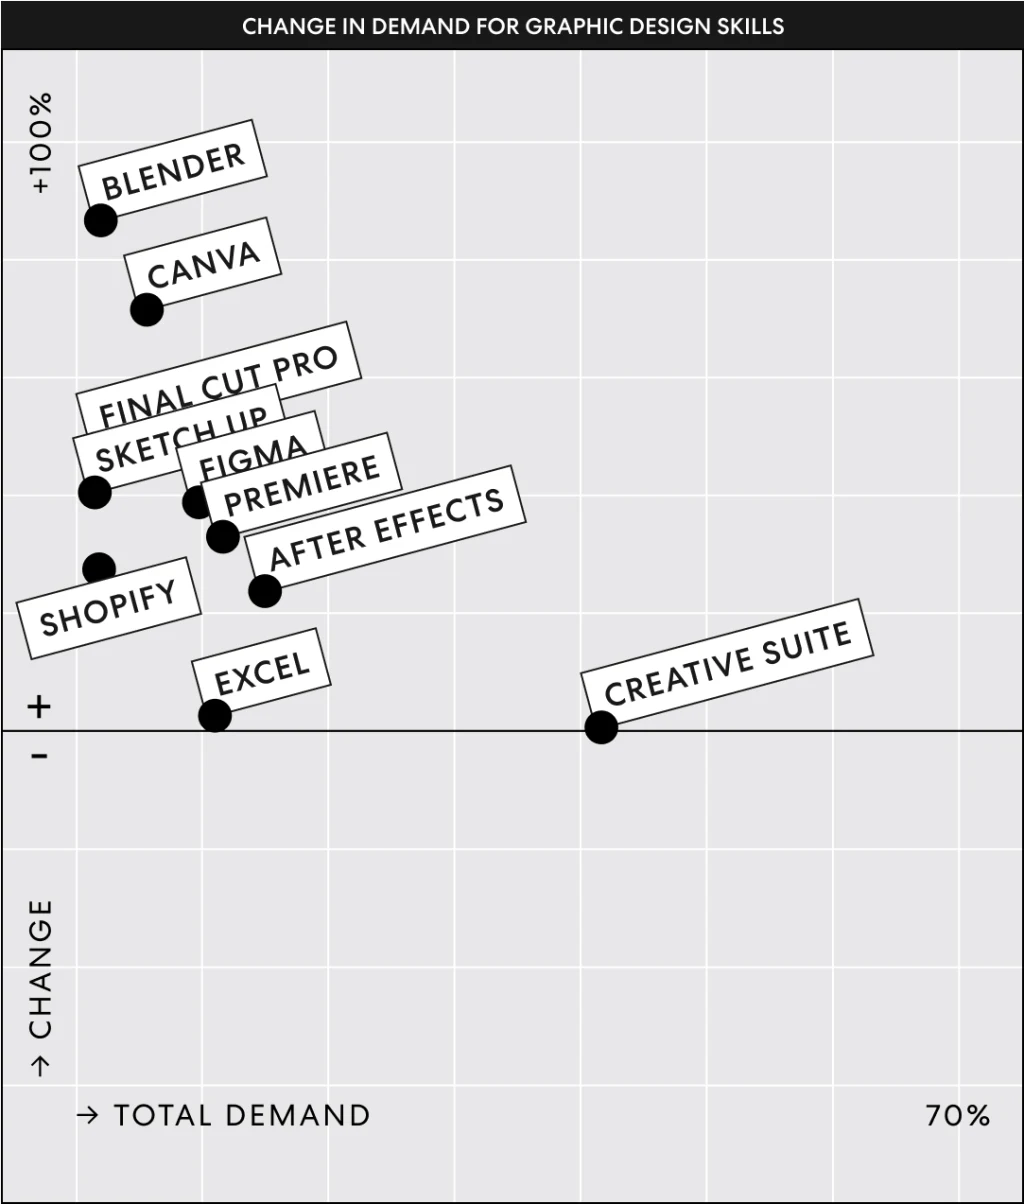
Blender & Canva
Sounds like Blender & Canva are taking over the 3D & 2D graphic design world - interesting! I'm not surprised to see Blender here, but Canva used to be considered an amateur tool. Read more about it here.
Friday, July 4, 2025
Two Different Story Maps
Here are two recent examples of story maps:
- The Internet Infrastructure Map is maybe not a 'classic' story map as such, but does tell the story of the expansion of undersea cables & more that represents the infrastructure of the Internet.
- Battles of the American Revolutionary War (by Esri) is a class Esri Story Map = a nice way to curate a lot of information across space & time. But...ultimately...not very compelling.
Sunday, June 29, 2025
Google's AI Hurricane Predictor
Saw this over on Maps Mania: Google has launched a new interactive map, Weather Lab: Cyclones, which shows AI-generated tropical cyclone forecasts and allows you to compare how different AI forecast models perform in comparison to traditional physics-based models.
Try it @ Google Weather Lab: Cyclones
Ai & Energy Use
This is a great multimedia story map interactive about AI & Energy Use from the MIT Technology Review: We did the math on AI’s energy footprint. Here’s the story you haven’t heard.
The Retro Weather Channel
This is fun: display NWS data using the retro look of the Weather Channel back in the days: https://weatherstar.netbymatt.com/
Tuesday, May 20, 2025
USA: Counties & Population
Very cool animated map of the basic problem of human geography in the USA and anywhere: most people live in small & densely-populated area while most of the country is pretty much empty.
Monday, May 19, 2025

Art x Climate
Very cool that this is part of the 5th National Climate Assessment: Art x Climate
And here's the matching journal article: Bringing art and science together to address climate change
Friday, May 16, 2025
Maps: Projections & Distortions
Here you can make your own version of reality: Country Centered Map Projections
- Select your projection.
- Select your map center.
- Make things really weird by adding a rotation or two.
- Share as link or PNG.
- Awesome!
Thursday, May 15, 2025
Chart Makers
Here are three options:
As always: user beware! Some of these 'free' ones / tiers can suddenly disappear or turn commerical.
Tuesday, May 6, 2025
The Climate Justice Instructional Toolkit (CJIT)
The Climate Justice Instructional Toolkit (CJIT) (by MIT) offers a wide-range of climate justice adaptable teaching modules, a starter guide for teaching climate justice, resources for students, and climate justice data sets that can serve as supportive tools to enhance professor and instructor teaching content and approaches.
StreetWhip
Explore the world by combing Street View & AI in StreetWhip - basically the inverse of all these geo-guessing games.
Sunday, May 4, 2025
IRB
Yep, the IRB process is both necessary & tedious.
- Excellent video here: Do you need an IRB??
- IRB Decision Tree (U. Wisconsin La Crosse)
Saturday, May 3, 2025
Choosing the 'right' AI tool!
Nice article in Nature: https://www.nature.com/articles/d41586-025-01069-0
All kinds of cool-sounding names: SciSpace, Claude, NotebookLM, etc. & I'm still not sure what these tools could do for me in-practice. But one thing is clear: as expected, there are 'free' versions with limited capabilities and various tiers of 'pro' versions that come at a cost. And here we go again: the rich can get themselves access to the good stuff & further entrench their privilged positions, whereas the poor get the 'decaf' versions.
This is a problem for Higher Education, both between colleges/universities and within them. Now it is not just about who has the coolest gyms & dining facilities, but who offers you access to the best AIs so that you can compete with others. Likewise, poor state-funded schools will not be able to offer any premium AI access to their students.
Sunday, April 27, 2025
Thursday, April 24, 2025
Sunday, April 20, 2025
Backcountry Skiing
Here are two excellent interactive web maps: one showing the backcountry ski options around Mount Mansfield, the other in the White Mountains:
I have never heard of that app (Backtrack Maps) - let's hope it stays around!
Thursday, April 17, 2025
Screen Recording with Zoom
Maybe I've been under a rock...but that's a quick & easy way to record short video of yourself, introducing an online class, etc. No need anymore for a different 3rd party app: just record the Zoom Meeting with yourself, share screen , use the whiteboard, save as MP4, upload to Youtube = done!
Saturday, April 12, 2025
The Earthporn Map
Unfortunate name, but there is nothing 'porn' about it - just a map of the r/EarthPorn is a subreddit: The Earthporn Map. Could be a useful tool to plan your next vacation!
How Fast Is the Earth Spinning Where You Are?
Cool little web animation - use it to better understand the Coriolis Effect: How Fast Is the Earth Spinning Where You Are?
Tuesday, April 8, 2025
Tuesday, April 1, 2025
The VOSviewer
From the website: VOSviewer is a software tool for constructing and visualizing bibliometric networks. These networks may for instance include journals, researchers, or individual publications, and they can be constructed based on citation, bibliographic coupling, co-citation, or co-authorship relations. VOSviewer also offers text mining functionality that can be used to construct and visualize co-occurrence networks of important terms extracted from a body of scientific literature.
Big Data
What is Big Data? Here is a nice & practical 'definition': Big data is a dataset that is too big to be processed using MS Excel. The term 'big' can mean a variety of things: size/volume (of course), but also update frequency (real-time maybe), containing a variety of data types, and dimensionality.
Thursday, March 20, 2025
Climate Havens vs. Heavy Rain & Flooding
Sure, there are no 'true' climate havens, but to me northern Vermont & other remain places remain 'practical' climate havens despite their exposure to risk from heavy rains & associated flooding (e.g. Asheville, NC).
WMO 2024 State of the Global Climate Report
Here is the 2024 State of the Global Climate Report from the World Meteorological Organization.:
- State of the Global Climate 2024
- State of the Climate 2024 (Esri Story Map)
- Extreme Events 2024 (Web Map)

Saturday, March 15, 2025
Deep Research Tools from OpenAI & Google
These tools can basically synthesize the information from 100s of websites into nice and tidy cited literature reviews. And that's great for many basic science & technology topics where there is enough information available out there on reputable online sources.
But the notion that this can replace a classic scientific literture review of meta-analysis is incorrect. First, these AIs do not have access to the actual scientific literature (which tends to sit behind paywalls). Second, there is a difference between a summary, a review, and a synthesis. Sure, a competent & trained amateur such as an AI can summarize, but reviewing & synthesizing requires a familiarity with the subject matter that can only be gained by years and years of deep immersion (aka. 10,000 hours...).
Sunday, March 9, 2025
Tuesday, March 4, 2025
The U.S. Climate Vulnerability Index
From the website: Pulling in 184 sets of data to rank more than 70,000 U.S. Census tracts, the U.S. Climate Vulnerability Index helps you see which communities face the greatest challenges from the impacts of a changing climate. This tool shows what is driving the challenges, so policymakers and communities themselves can take action to build climate resilience where it is needed most.
The MoAT: The Museum of All Things
This is just cool: The MoAT: The Museum of All Things
From the website: The Museum of All Things (or "The MoAT") is a nearly-infinite virtual museum that you can visit for free on your computer! You can find exhibits on millions of topics, from Arts in the Philippines to Zinc deficiency! The breadth of the museum is made possible by downloading text and images from Wikipedia and Wikimedia Commons. Every exhibit in the museum corresponds to a Wikipedia article. The walls of the exhibit are covered in images and text from the article, and hallways lead out to other exhibits based on the article's links.
One caveat: you need to actually download the museum software onto your computer:
- https://mayeclair.itch.io/museum-of-all-things (Windows, Mac, OpenXR, etc.)
- https://github.com/m4ym4y/museum-of-all-things (for the nerds)
Wednesday, February 26, 2025
Rail Transit Access vs Population Density
Rail Transit & Population Density compares and ranks 250 cities around the world - the side-by-side map and table comparison is great!
Thursday, February 20, 2025
America's Drunkest and Driest Counties
Fun: America's Drunkest and Driest Counties - explain these spatial patterns!
The Milky Way Map
This is apparently the largest map of the Milky Way: https://archive.eso.org/scienceportal/home. Very cool, but I'm not sure what anyone can do with this...here's a little more beta from Joe Kerski.
Thursday, February 13, 2025
3D Print Your World
Great compilation of tools by Maps Mania: 3D Print Your World
- Topography Explorer
- DEM Net Elevation API
- Tiel Exporter
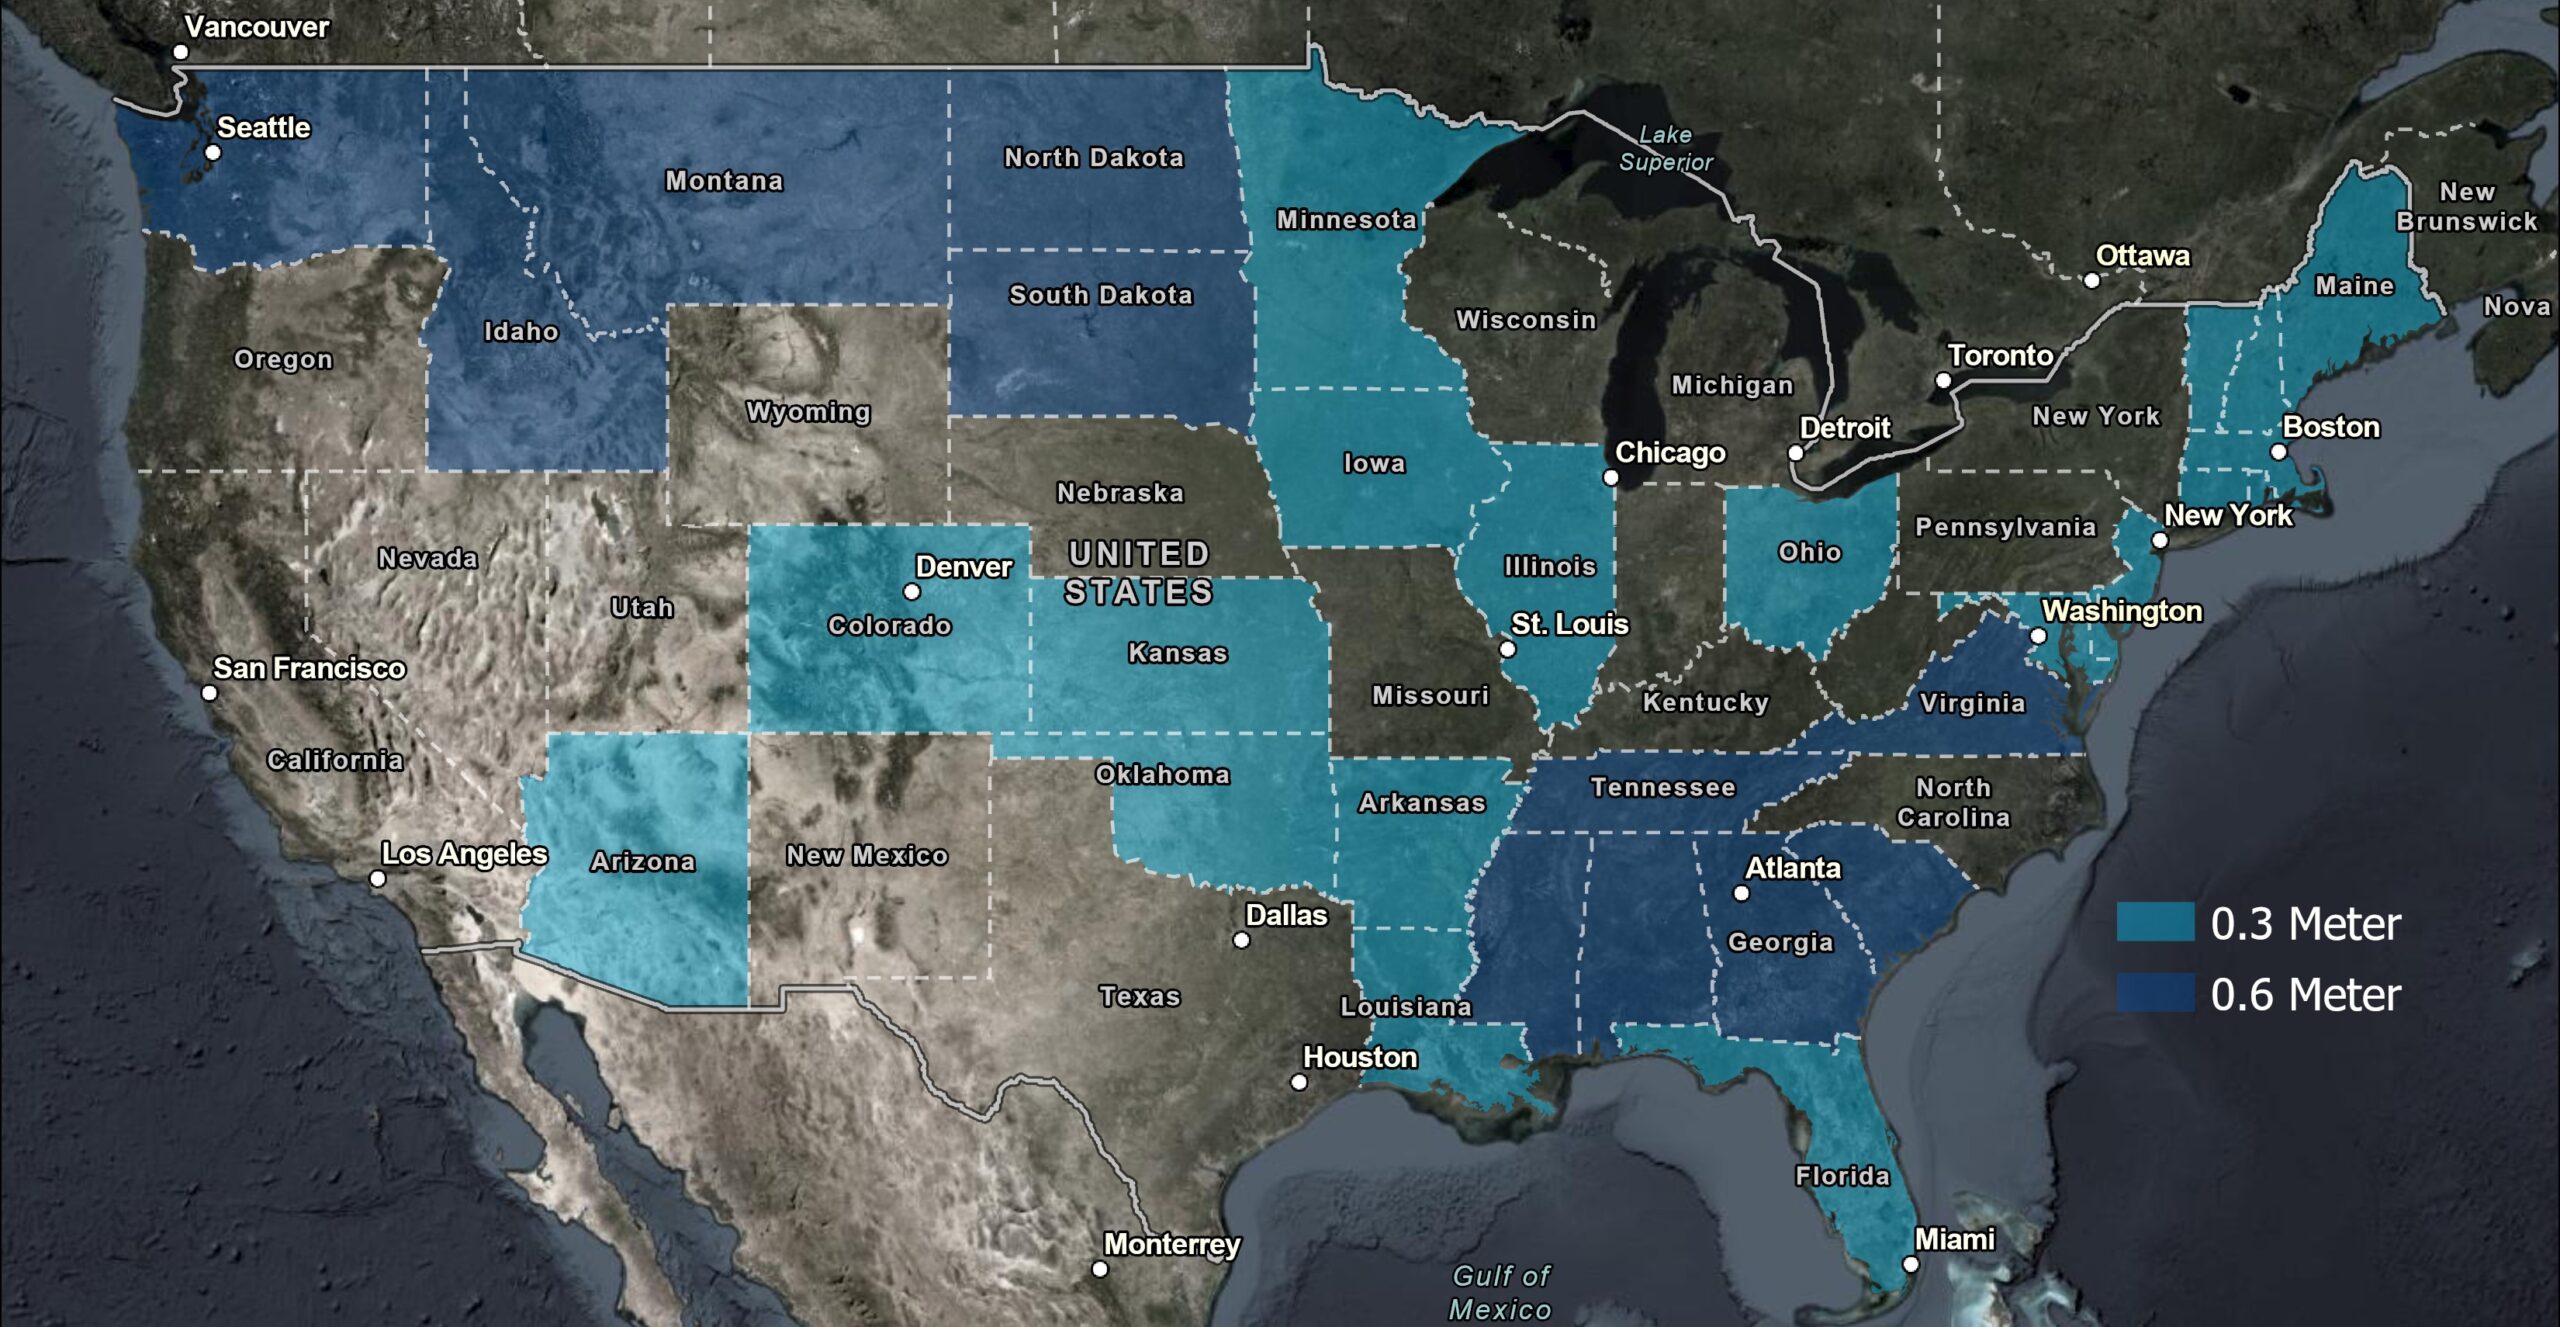
NAIP 2023 Imagery
I always forget about the NAIP Imagery - a great source for free satellite data at pretty decent resolution (30 cm / 60 cm).
More here:
Esri Story Maps: Categorized Map Tours
This could be a useful template for Esri Story Maps: categorized map tours. Here's an example: https://arcg.is/0b8vi42. The process sounds a little 'campy' & seems to require to have/create a feature service first?
Here's how to create a map tour from actual ArcGIS Data: Create a data-driven map tour
Saturday, February 8, 2025
Godview AI
Godview is basically an AI with a map interface that allows you to perform 'classic' AI stuff, bur with geographic output & also to discover things based on clicking around.
Thursday, February 6, 2025
How To Digitize Fast!
Brilliant video tutorial on how to digitize complex geographic features (e.g. glacier margins) fast & precise:
Tuesday, February 4, 2025
The Street View Animator
The Street View Animator looks like great fun - more about it over @ Maps Mania.
My only concern is 'permanence' - these types of apps have a tendency to disappear after a while & then all your work disappears as well. This makes it a little risky to committ to it as a teaching tool.
Sunday, February 2, 2025

Saturday, February 1, 2025

GLOBAL GLACIER CASUALTY LIST
The GLOBAL GLACIER CASUALTY LIST is nicely-done Esri Story Map - good luck keeping it updated!
Thursday, January 30, 2025
Poe
Of couse this would happen: there are so many LLMs out there that one can use & now we need some kind aggregator & here is one of them: https://poe.com/about
Backcountry Ski Routes in the Presidential Range of New Hampshire
Well-done in CalTopo: https://caltopo.com/m/4U821FC
This would be great as a Story Map with linked / embedded pics & videos. More beta in his video:
Sunday, January 26, 2025
Padlet!
Ah yes...we all used Padlet during COVID, but many of us (certainly me) have stopped using Padlet now that we are F2F again. But Padlet still works great, for example:
- Video Discussion Board where the students post one relevant video for a topic, for example ozone & global warming.
- Or, do the same with figures.
- There is also a Video Recorder where they could record a brief video of themselves talking into the camera.
Unfortunately, the free version of Padlet is limited to just 3 'padlets'...not sure how you could in-practice use that for daily teaching.
Saturday, January 25, 2025
GeoSpy
GeoSpy can geoference photographs without any spatial information & apparently it works quite well - more @ https://flowingdata.com/2025/01/23/geolocating-photos-automatically/
That's pretty cool & also scary...no hiding anymore from the AI...
Thursday, January 23, 2025
Teens & Social Media
Teens, Social Media and Technology 2024 by the Pew Research Center leads with this chart. Not sure what to make of it, but 1) YouTube rules, 2) TikTok & Instagram & Snapchat are important, 3) Twitter is irrelevant, and 4) Facebook is holding steady after dropping like a rock.

An Extremely Detailed Map of the 2024 Election
An Extremely Detailed Map of the 2024 Election by the NYT shows the 2024 election results down to the precint level & the data are available as well!
The Copernicus Interactive Climate Atlas
The Copernicus Interactive Climate Atlas is awesome - have a look! You can display measurements, reanalysis, and model data at all kinds of geographies & time scales. And: download the data in a bunch of formats.
It is just too much...nobody will use it. Expert scientists will access the data directly and the general public will scared off by the complexity. This is really designed for the rare 'regular' person who is interested & competent enough to figure-out the tool.
Suggestion: Make a simplified version or walk-through video.
Tourism & AI
Cool combination of tourism & AI: Google Talking Tours. Here Google combines Street View images & panoramas with an AI-generated narrative. Currently this only covers some 55 major sites, but you can easily envison this for literally anywhere.
SAR 'Images' in ArcGIS Pro
Good stuff here in-case you need to process SAR imagery in ArcGIS Pro: Getting to Know the SAR Analysis Toolset.
Subscribe to:
Comments (Atom)