Thursday, March 26, 2026
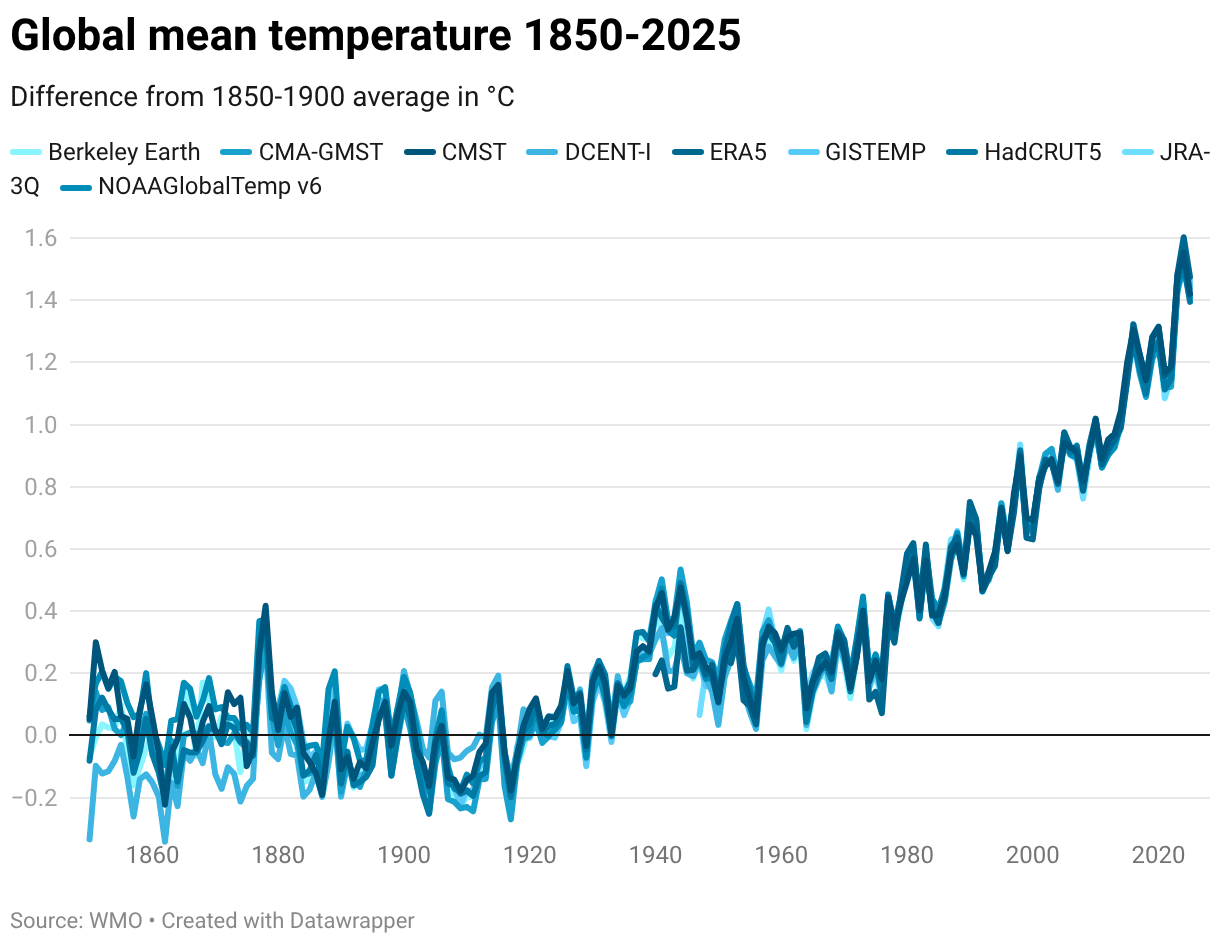
State of the Global Climate 2025
The State of the Global Climate 2025 by the WMO is out and confirms once again what we have already known for decades. This one comes with a cool ArcGIS Dashboard of the 2025 Extreme Events, a great tool for presenting such data.
Tuesday, March 24, 2026
The Dance of the Continents
Dance of the continents is a very nice Esri Story Map showing the interplay of plate tectonics and evolution over the last 600 million years. I especially like the first section where you can step backwards in time to see the (current) continents come together first as Pangea and then again as Rodinia.
Wednesday, March 18, 2026
AI & Jobs: Vulnerability
Saw this on Flowing Data: Jobs vulnerable to AI. This links to Measuring US workers’ capacity to adapt to AI-driven job displacement where the authors 'mapped' job vulnerability as a function of a) exposure andb) adaptability.

Tuesday, March 3, 2026
Defossilization
That was a new term for me: defossilization. We will still very much need carbon-based compounds (even after we transition to 100 percent sustainable energy) for manfacturing of plastics, detergents, medicines, and more.
Okay, so we still have plenty of oil around...so why not use the oil for that? We should have plenty 'excess' capacity in the oil fields! Plan is a CO2-to-methanol process powered by solar energy and then the methanol is converted to olefines (e.g. ethylene & propylene) which are petrochemicals that can be used to manufacture plastics and more.
Sunday, March 1, 2026
Bill McKibben
Bill McKibben is always a worthy read & watch:
Here's his main take from the article:
The 'old' heart of Christianity was lover & concern for other as lived by Jesus. The 'new' heart of Christianity is personal salvation and that required them to 're-make' Jesus into some else entirely.
Back in the late 1950s, some 52 percent of Americans were part of the so-called mainline denominations (e.g. Methodist, Lutherans, Congregationalists, Episcopalians, etc.) and about 33 percent were Catholics. Modern Christanity is instead dominated by megachurches, TV ministries, and right-wing evangelicals who are the MAGA core.
Mainline Protestantism surrenderd their version of Jesus to this new toxic form of Christianity without a fight & we see the same thing today with America: we are surrendering our version of America (as imperfect as it is) to MAGA without much of a fight.
Saturday, February 21, 2026
Saturday, February 7, 2026
Friday, February 6, 2026
Data Center Infrastructure in the United States (2025)
The map of Data Center Infrastructure in the United States, 2025 is just that: a classic 'static' map.

Thursday, February 5, 2026

Saturday, January 31, 2026
Food Deserts / Grocery Deserts
Great web map: Mapping Food Deserts and Grocery Store Consolidation
Now...if they would only offer a way to download the data!
Thursday, January 29, 2026
The Oldest Globe
As seen on Maps Mania: the world’s oldest surviving terrestrial globe from 1492 that obivously does not yet include the Americas!


Sunday, January 25, 2026
Letters From The Earth
Cool project & something that I have been thinking about: sure, we have plenty of data & facts, but now can those be made a) meaningful to b) promote reasonable actions?
Letters From The Earth uses AI to translate 'boring' data into expressive text = If the Earth could describe its own day using the same signals we collect about it, what would it say?
Their Core Hypothesis: Data contains expressive qualities beyond analytics, and AI can translate those qualities into new modalities that invite more people to participate in understanding and meaning.

Thursday, January 8, 2026
Cloud Optimized Data Formats
Cloud Optimized Data Formats is about as boring as it gets...but not when they are explained in a fun zine-comic book! Here's the link: Optimizing Geospatial for the Cloud
Brilliant!
Brilliant has been around for a while, but the free version always has been a little limited. But there is an Education Version for K-12 as well that offer free premium access - might be interesting!
Napkin.ai
From the website: "Napkin turns your text into visuals so sharing your ideas is quick and effective." Sounds interesting and there is a free version.
Try it here: https://www.napkin.ai/
Thursday, January 1, 2026
EMBER
EMBER offers great data and nice visual data explorers for all kinds of domestic and international energt data. The data are available for download as CSVs and the interactive charts as PNGs and the data for each chart as CSVs as well = great!
.png)
Subscribe to:
Comments (Atom)