
Saturday, July 28, 2018
Friday, July 27, 2018
2016 Election at the the precinct level
States - Counties - and now we can explore the 2016 election results down to the precinct level with An Extremely Detailed Map of the 2016 Election by the NYT. Well-done!
Thursday, July 26, 2018
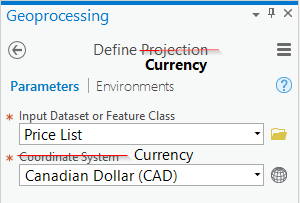
Define Projection or Project?
Define Projection or Project? is a nice and concise explanation of the Define Projection and the Project tool in ArcGIS (the currency analogy is great!).
QGIS 3 Beginner's Basic Tutorial
The QGIS 3 Beginner's Basic Tutorial is a nice and quick way to get to know QGIS.
Friday, July 20, 2018
Visual Vocabulary
Visual Vocabulary is a cool interactive (created in Tableau) that connects data relationships to their most appropriate data visualizations. That's similar to the Chart-Doctor poster.


Wednesday, July 18, 2018
The Wayback Machine
From Esri: Wayback imagery is a digital archive of the World Imagery basemap, enabling users to access more than 80 different versions of World Imagery captured over the past 5 years.
- Read more at Wayback - 81 Flavors of World Imagery
- The World Imagery Wayback app
- Using World Imagery Wayback
I suppose going back 5 years is useful, but a longer time frame would be better.
Mastering Geospatial Analysis with Python
Mastering Geospatial Analysis with Python looks like a great book for those interested in using Python for geospatial analysis.
Tuesday, July 3, 2018
A Crash Course in Cyclogenesis and Conveyor Belt Theory
This is quite good: A Crash Course in Cyclogenesis and Conveyor Belt Theory.
 |
| https://www.mountwashington.org/uploads/Conveyor.jpg |
Assessment of Undergraduate Research – from David Lopatto
Good stuff from Laura Guertin: Assessment of Undergraduate Research – from David Lopatto.
All the building footprints in the United States
Found on FlowingData: All the building footprints in the United States. That's 124,885,597 computer-generated building footprints created by Microsoft and available as open-source.
Now here it is mapped by the NYT: A MAP OF EVERY BUILDING IN AMERICA
Now here it is mapped by the NYT: A MAP OF EVERY BUILDING IN AMERICA
FloodRisk
FloodRisk is a plugin for QGIS to quantify flood impacts and risks. Here are a few papers using FloodRisk:
- FloodRisk: a QGIS plugin for flood consequences estimation (Mancusi et al. 2015)
- FloodRisk: a collaborative, free and open-source software for flood risk analysis (Albano et al. 2017)
- Using FloodRisk GIS freeware for uncertainty analysis of direct economic flood damages in Italy (Albano et al. 2018)
Monday, July 2, 2018
Subscribe to:
Posts (Atom)