Panorama-stitching applications have been around for a while now...it started with GigaPan and their robotic tripod panorama heads. Now we have Microsoft Photosynth (and others) which made all this much easier and usable on smart phones.
Autodesk 123D Catch takes this one step further and combines images of a stationary object into 3D models. That's nothing really new either and uses a process referred to as Structure from motion (see for example VisualSFM or Bundler).
Autodesk 123D Catch claims to make this more accessible to consumers with an online version and iPhone/iPad apps (in addition to a downloadable version for Windows). I have not tried any of this myself so have a look at this review or this one to get more information.
Wednesday, May 29, 2013
Mobile Geoscience
Here is a nice compilation of apps for tablets and smart phones that can be used in geoscience education and research: Mobile Geoscience

Sunday, May 26, 2013
Stimulating STEM
This feels like listening to a broken record: careers in STEM are growing, but the US education system is incapable of delivering good STEM education - we have talked about this for the last 20 years! But, if you want to see it again...have a look at this infograhic:
- Stimulating STEM (also here)
In fact...you could argue that our education leaders have already thrown-in the towel with respect to STEM and are now talking about civic engagement to fix our flawed education system - which is bogus. If anybody is interested: I have the solution and it is simple and quick (Barack - call me!).
Saturday, May 25, 2013

What is Spatial Thinking?
This is another one of these issues that demonstrates how geographers continue to struggle to justify their existence as a science...what is it we do and teach and argue that everyone should be excited about?
Spatial Thinking = Geographic Perspective = Geographic Reasoning (it's all the same!).
Joe Kerski (Esri) defines spatial thinking as "identifying, analyzing, and understanding the location, scale, patterns, and trends of the geographic and temporal relationships among data, phenomena, and issues." The goal is then to cultivate spatial thinking as a useful habit of mind (similar I suppose to cultivating the scientific method as such) to analyze how the world works, including how systems function, how and why certain relationships exist, and also how we might approach and solve problems.
Here's the link to the full essay.
The Art of Data Visualization
You got data, you got software, and you can create graphs to visualize those data. That's easy. But, how do you visualize data effectively and beautifully? Here are some useful sources:
- The Art of Data Visualization (PBS video)
- Data Points: Visualization that means something (book by Nathan Yau)
- Flowing Data (blog by Nathan Yau)
- Edward Tufte (the guru of data visualization)
Friday, May 24, 2013
What is Geographic Reasoning?
This is an excellent column by Daniel Edelson (VP for Education at the National Geographic Society) in ArcNews (Spring 2013).
Our challenge as geographers is always the same: nobody understands what modern geography actually is...which makes it really difficult to convince them that we need more and better geography education. in some point during the conversation we usually throw-out the term geographic reasoning...that generally fails because we cannot define without circular reasoning...now what?
Edelson suggests the core components of geographic reasoning (and I modified slightly):
- Measuring and mapping geographic distributions (= where is stuff?)
- Identifying patterns and clusters (= stuff usually does not occur randomly on Earth!)
- Identifying paths and flows (= think roads and traffic!)
- Analyze these geographic relationships (over time, if applicable)
Thursday, May 23, 2013

150 to 270 Billion Dollars!
Whow! That's the revenue generated by the Geo Services sector (= all interactive digital mapping and location-based services). For reference: the video gaming industry generates about 25 billion dollars revenue. Plus, this industry is growing globally at a rate of about 30 percent! What does all that mean?
- If you want a job as a geographer: learn GIS!
- This report was commissioned by Google...so the numbers may be leaning more towards on side than the other (but, cut the values by half and you still have impressive revenue and growth.
Read the full report What is the economic impact of Geo services?
Wednesday, May 22, 2013
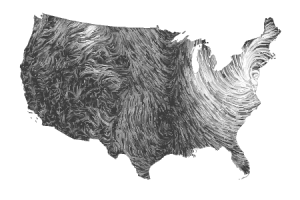
Tornados
Lot's of news and writing about tornadoes today after what happened in Oklahoma two days ago - here are some useful sources:
- 1950 to 2011 tornado tracks (by month, video)
- Interactive tornado mapping (very cool!)
- Scientific and historical context (from The Atlantic)
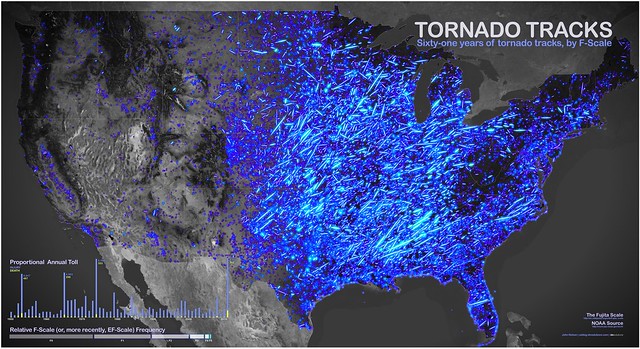 |
| 1950 to 2011 tornado tracks |
Tuesday, May 21, 2013
Quelccaya Ice Cap (1988 to 2010)
Here's another visualization using Landsat 5 satellite images: the Quelccaya Ice Cap in 1988 and in 2010. The images are unfortunately not labeled, but it's pretty obvious which is which by looking at the recession of the ice margin.

Fly with Landsat 8!
Good work NASA: fly along with Landsat 8 on a 6,000 mile long trip from Russia across the Arabian Peninsula and into southern Africa. Choose Youtube, GigaPan, or Google Earth as your viewer - cool!
Sunday, May 19, 2013
Storytelling with Maps
Esri has been pushing this for a while now: Storytelling with Maps. Not a bad option for creating and sharing interactive web maps that incorporate various types of media. After playing around with it and creating the story map below here are a few things I learned: 1) You really need an ArcGIS Online for Organizations account, 2) the template I used is still a bit buggy, and 3) seems to work best in Firefox.
- Storytelling with Maps
- Embedding Story Maps in websites
- Using the Map Tour template
- Link to my Story Map
- Snap2Map app - great!
Looking for an alternative to Esri? Try out Odyssey from CartoDB, Heganoo, Visits, MapStory, or have a look at Seven Ways to Create a Storymap.
The Myths of College
This infographic raises a few interesting questions to ponder as students graduate from high school and get ready to start college in the fall. Consider this: college costs you (at least) 4 years of your life and a lot of money...both directly and indirectly (money spent and money not made) - it is the largest investment of time and money you will ever make - are you ready for that?
Along those lines: for folks interested in science, technology, graphic design, media, business, etc. - learn a little computer programming along the way to your degree!
Along those lines: for folks interested in science, technology, graphic design, media, business, etc. - learn a little computer programming along the way to your degree!
Saturday, May 18, 2013
Climate Change is real!
At least according to 97.1 percent of relevant scientific papers published between 1991 and 2012 - good enough to start talking about what to do about it? This approach = meta analysis and result is nothing new in this context: Naomi Oreskes published a similar analysis with similar results back in 2004 (Science, 306: 1686) and then there are the IPCC Reports that document a clear and robust scientific consensus on this issue.
- Read more at Smithsonsian.com
- Or at It's Okay to be Smart
- Or, read the actual paper
Friday, May 17, 2013
Citizen Science
Nothing really new here - this has been around for a long time (remember the GLOBE Program?). But people are talking about it again...so here are some recent sources of information.
- Nature (11 April 2013) - Amateur experts
- Old Weather
- eBird
- Citizen Science Alliance
- Citizen Science Central Toolkit
- Data Management Guide

Thursday, May 16, 2013
TileMill and MapBox
TileMill is a free open-source application to create beautiful data-driven maps. Share your map via MapBox.
- TileMill
- MapBox
- Illustrated Guide
- Nice TileMill tutorials by Gretchen Peterson
- Create games with MapBox and TileMill (via Google Maps Mania)

Tuesday, May 14, 2013
Gephi and Neatline
I'll be honest: I'm not quite sure what one would exactly do with Gephi - interactive data visualization, particularly suitable for large complex networks and systems. But, it's a free, open-source, and runs on Windows, Linux, and Mac OSX so why not try it?
Neatline is a tool or framework to tell stories with maps and time. This is a bit trickier and comes as a suite of plugins for Omeka (a content management and web publication platform). But, there is also a live online sandbox. This looks to be somewhat similar to Storytelling with Maps by Esri.
Monday, May 13, 2013
Life after Graduation
Well - what career should you choose? This is a question much better dealt with years before graduation...but one way to find an answer is to look at salary potential and number of people employed.

Click image to open interactive version (via Rasmussen College).
Click image to open interactive version (via Rasmussen College).
Internet Census 2012
From the paper: how big is the Internet? That depends on how you count. 420 Million pingable IPs + 36 Million more that had one or more ports open, making 450 Million that were definitely in use and reachable from the rest of the Internet. 141 Million IPs were firewalled, so they could count as "in use". Together this would be 591 Million used IPs. 729 Million more IPs just had reverse DNS records. If you added those, it would make for a total of 1.3 Billion used IP addresses. The other 2.3 Billion addresses showed no sign of usage.

- Need details? Read the paper!
- Great maps and animations (watch activity drop as night travels around the earth!)
- Here's a simpler approach
Friday, May 10, 2013
Landsat Timelapse 1984-2012
Well-done Google: sequencing Landsat images from 1984 and 2012 to show urban sprawl around Las Vegas (also note water level in Lake Mead), deforestation in Brazil, and more!
Click over to TIMELAPSE (by Time Magazine) to see these timelapse sequences explained, discussed, and converted into a series of excellent and annotated videos.
The History of Fonts!
Sounds boring? Have a look: this is well-done and fonts can make a big difference in mapping and data visualizations.
Wednesday, May 8, 2013
Quelccaya Ice Cap 1988 to 2010
This is a great comparison of the Quelccaya Ice Cap in 1988 and in 2010 using Landsat 5 satellite images - NASA did a great job with the image enhancements! Even better: click-on the VIEW IMAGE COMPARISON button and use the vertical slider to seamlessly transition between the two images.
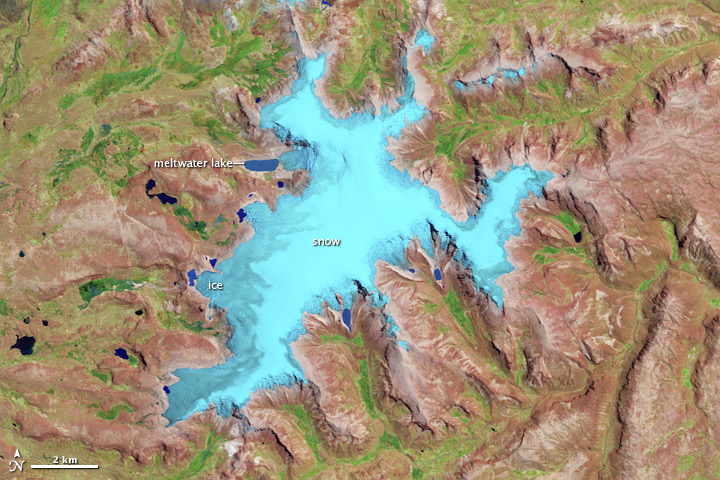 |
| Quelccaya Ice Cap (16 September 2010) |
Sunday, May 5, 2013
Structure from Motion
Structure from Motion (SfM) refers to algorithms by which you can calculate - based on many overlapping images - both the relative camera geometry (motion) and the 3D structure captured by the image (structure). Thus, in theory, you can take a whole bunch of pictures of say of a hillside or a glacier and create a digital surface model using SfM - intriguing!
Examples: Westoby et al. (2012) or Ryan et al. (2014).
Nice review of SfM: Smith et al. (2016)
Examples: Westoby et al. (2012) or Ryan et al. (2014).
Nice review of SfM: Smith et al. (2016)
- Bundler (Univ. of Washington)
- VisualSFM (Univ. of Washington)
- Agisoft (commercial product)
- SFMToolkit
Fairbanks Fodar is a semi-commercial company out of Fairbanks (AK) claiming that they can deliver LiDAR quality data at 10 percent of the cost.
Saturday, May 4, 2013
Raspberry Pi
The Raspberry Pi is a credit-card sized computer that plugs into your TV and a keyboard. It’s a capable little computer which can be used for all kinds of fun (and useful) applications.
Subscribe to:
Comments (Atom)