Wednesday, December 30, 2015

Homo Sapiens - Child of the Ice Age

Homo Sapiens - Child of the Ice Age is an interactive 'story map' where you can trace and visualize the connections between human evolution and climate change over the last 4 million years.

The New Normal

Extreme heat events are more frequent by WXshift is a nice illustration of the so-called New Normal.


Scale of the Solar System

Global View: Climate Change in Perspective

Global View: Climate Change in Perspective by BloombergView is a nice and simple story map with a minimalist layout and design.

2014: The Hottest Year

This may have to get updated once the data for 2015 are all analyzed, but 2014 Was the Hottest Year on Record is a great visualization!

The Swiss Topography in 3D

Super-cool: Swiss Topo

GPS Radio Occultation

For GPS users the atmosphere introduces errors, but someone's errors are other people's treasure: weather forecasting using GPS radio occultation and CubeSats, in-essence a new way to get massive amounts of atmospheric profiles from all over the world.


Earth Primer

Earth Primer looks great - a geology 'textbook' that explains and simulates the ways in which lava, wind, temperature, and water shape our planet. The built-in simulator puts geological forces at your disposal to carve out canyons, grow volcanos, smash continents together, and more. Read more about it here.

Earth, A Primer — App preview from Chaim Gingold on Vimeo.

IR Thermometers for Smartphones

I'm always intrigued by IR thermometers that can be viewed via a smartphone - these can be great teaching tools when explaining the concepts around electromagnetic radiation - here are three options:
  1. The Ryobi Phone Works IR Thermometer and App ($40)
  2. The SEEK Compact or Compact XR ($249/$299)
  3. The FLIR ONE ($249.99)

Thursday, December 17, 2015

2000 Years of Urban Growth in 3D

2000 Years of Urban Growth in 3D is cool, but I agree with Maps Mania: no need for a map and certainly no need for a 3D globe.

Why Do Rivers Have Deltas?

Historical Geography of the United States

Here is the digital version of Charles O. Paullin and John K. Wright's Atlas of the Historical Geography of the United States, first published in 1932, beautifully prepared by the Digital Scholarship Lab, University of Richmond.

There is so much good material in there, for example travel times and distances from New York City in 1800, 1830, 1857, and 1930.

Update: American Panorama is an historical atlas of the United States for the twenty-first century.

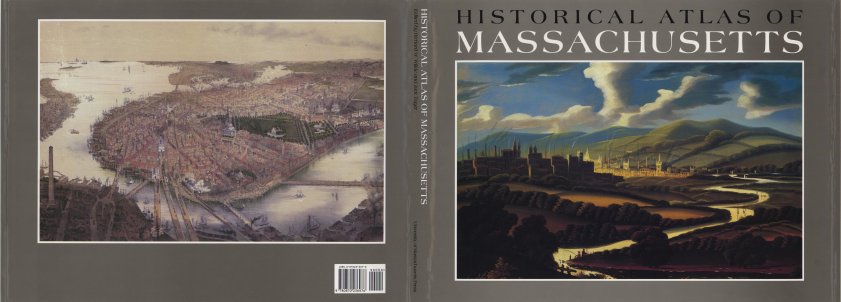
There is a similar atlas just for Massachusetts: The Historical Atlas of Massachusetts by Richard Wilkie and Jack Trager (1991), but the digital version is not quite as sophisticated.


The BP Energy Charting Tool

The BP Energy Charting Tool seems cool and I like the fact that you can grab the data, but I could not figure-out easily how to use it.

DHIS2

DHIS2 looks pretty great: flexible, web-based open-source information system with awesome visualization features including GIS, charts and pivot tables.

Wednesday, December 16, 2015

Thursday, December 10, 2015

I am worried about my grade

Good Videos!

These videos about climate change are not necessarily all that new, but It's Okay To Be Smart does a nice job synthesizing the complex issues into watchable videos:
  1. Climate Science: What You Need To Know
  2. Why People Don't Believe In Climate Science
  3. The Sixth Extinction
This goes along nicely: Short Answers to Hard Questions About Climate Change (Justin Gillis, NYT 28 November 2015)

World City Population 1950 - 2030

World City Population 1950 - 2030 is a nicely-done interactive map using stacked graduated symbols - and that actually works in this case. Also nice: a Map Guide and Analysis pop-up window is included.

Map of Gun Deaths

How Many People Have Been Shot Near You This Year? is exactly what it says it is: an interactive map of American gun violence.

Friday, December 4, 2015

Your Country's Energy Mix

I'm not really liking the viz, but the data and information shown is pretty great - this is basically a realistic blueprint for a largely carbon-free world by 2050. And by that a welcome antidote to all this push towards geoengineering as the only viable 'solution'. Have a look at How Could Your Country's Energy Mix Look?

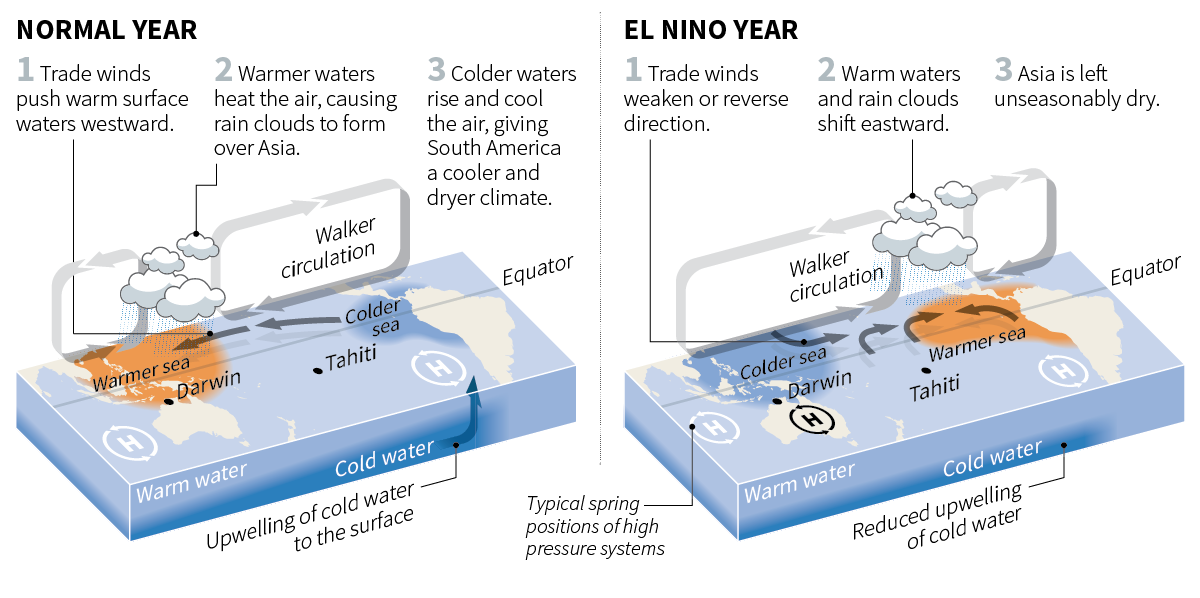
How El Nino affects weather

And a nice interactive chart of southern oscillation index: How El Nino affects weather


Gauging a warming world

Pretty impressive infographic / article by the Washington Post: Gauging a warming world

Thursday, December 3, 2015

Map Channels

Yep, Map Channels is yet another simple interactive web mapping platform draped over Google Maps.

Shifted Maps

The Quantified Self movement has been around for a while now, but lately has exploded with the advent of inexpensive 'fitness' trackers that everyone seems to be wearing on their wrists these days. Of course, you can also use your smartphone with the Moves app and then visualize the the collected data using Shifted Maps.

Six graphics that explain climate change

Six graphics that explain climate change by the BBC News is simple - perhaps too simple - but presents a nice introduction to the issues of modern-day human-caused climate change. The key figure is the last one in my opinion.

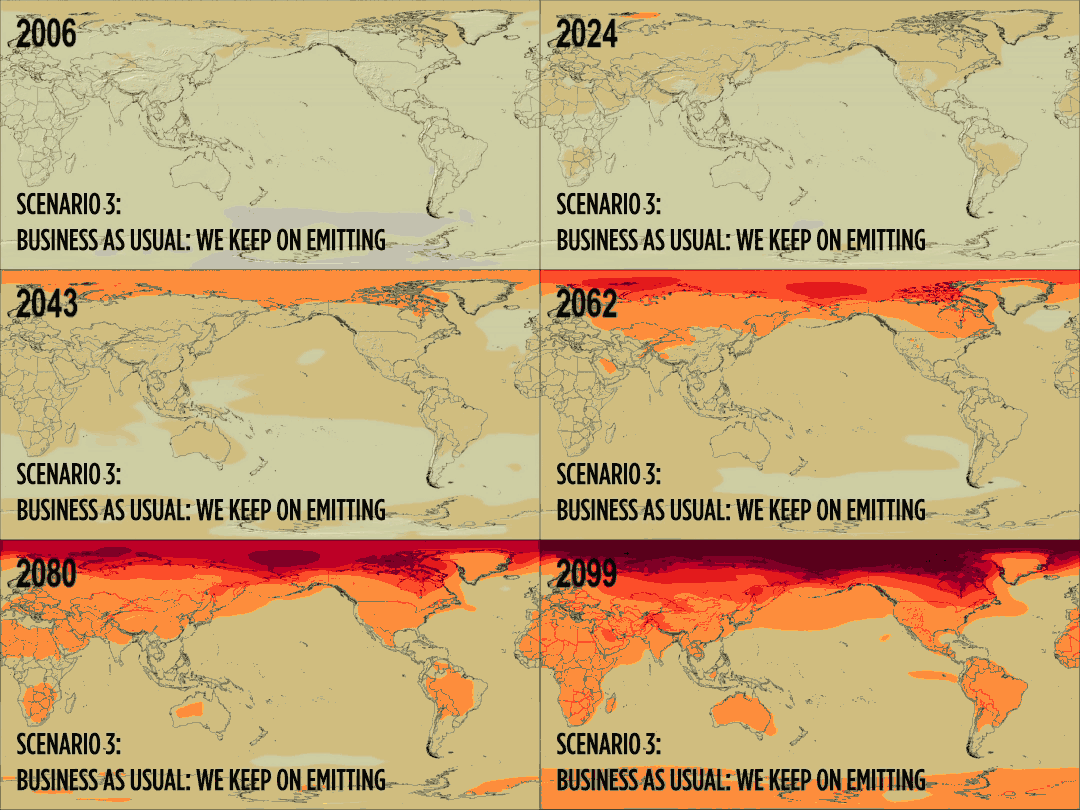
Plan A, Plan B, or Plan C

How Will The Earth Warm? It Depends are three nice and simple animated GIFs showing three different versions of global warming until the end of the century that depend on our choices today. Here's the BAU future:


Plume Air Report

The Plume Air Report claims to be the first worldwide interactive map of air pollution. I don't think that's entirely correct, for example see The World Air Quality Index Project or this effort by Yale University.

D3plus

D3plus makes interactive data-vz using D3 easier and that's a good thing for us non-JavaScript nerds. Plan B: use Plotly.