Here are two crowd-sourced photo story maps:
Friday, September 29, 2017
Thursday, September 28, 2017
Monday, September 25, 2017
Climate Ready Boston Map Explorer
Climate Ready Boston Map Explorer is a new way to look at the same data - here using the Esri ArcGIS Online platform. Coastlines of Boston is a nice supplement! (found on Maps Mania)
Alternatives to Google Docs
Here are two alternatives to Google Docs.
I'm not sure any of those fundamentally address the issues and concerns that one might have with Google Docs.
Nukemap and Misslemap
Tuesday, September 19, 2017
StorylineJS
StorylineJS looks great - a simple way to create an annotated and interactive chart (just point to your data in Google Sheets).
Kilauea: Fountains of Fire
Kilauea: Fountains of Fire is a pretty neat Esri Story Map and the creator explains the process of making here at The Making of Kilauea: Fountains of Fire. Here's a pretty cool animated GIF:
 |
| https://blogs.esri.com/esri/arcgis/2017/09/13/the-making-of-kilauea-fountains-of-fire/ |
Wednesday, September 13, 2017
Rising Seas
Here we have a web map with the actual sea level measurement station data: Rising Seas. This shows the actual measured values, not predicted ones say for the 21st century.
Tuesday, September 12, 2017
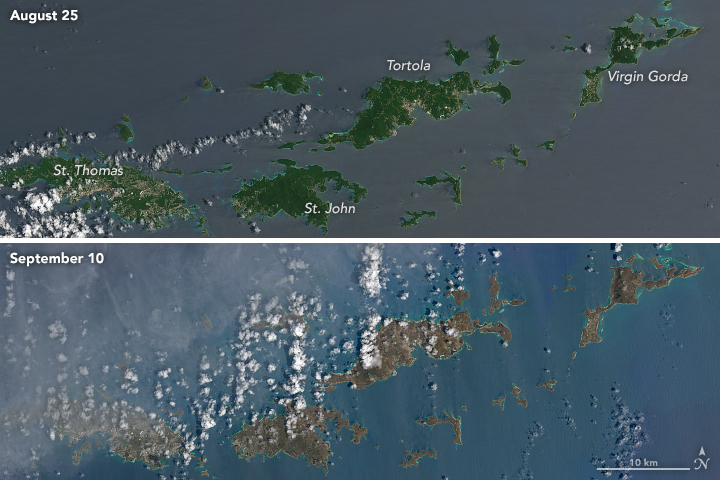
Irma and the Islands
Saturday, September 9, 2017
Monday, September 4, 2017
ArduPilot Autopilot Suite
The ArduPilot Autopilot Suite is everything and more you need for any kind of autonomous vehicle. More also here.
Sunday, September 3, 2017
Harvey Before and After
This is a great use of the Swipe Story Map: Hurricane Harvey Post Event Imagery - Houston.
Friday, September 1, 2017
The Last Glacier of Venezuela
Matthew Wills actually read the paper and wrote a nice summary for JSTOR Daily (29 August 2017): The Last Glacier of Venezuela.
Pipeline Spills
Here's an interesting interactive map showing pipelines, pipeline operators, and spills. That's about it. The map is not very professional, for example: use aliases for the field names and include a link to the data. This would have been better in Tableau in my opinion.
Subscribe to:
Comments (Atom)

