Saturday, November 30, 2019
NetCDF into ArcGIS Pro
The lesson Explore Future Climate Projections is pretty good and nicely-shows how to import and map NetCDF files (and convert to tables).
Friday, November 29, 2019

Thursday, November 28, 2019
Wednesday, November 27, 2019
Common Online Data Analysis Platform (CODAP)
This looks great: Common Online Data Analysis Platform (CODAP): a web-based and free data exploration and analysis tool.
Using R with 7th-grade science students
Using R with 7th-grade science students does not seem like a good idea to me (based on my experience teaching undergraduates at a public 4-year college in Massachusetts), but take a look yourself.
Tuesday, November 26, 2019
Superfund Sites and Climate Change
Superfund Sites and Climate Change (from the GAO!) is just a simple interactive web map and the data are provided as an MS Excel spreadsheet.
Saturday, November 23, 2019
Docker, Binder, Colaboratory, and more
If you are interested in any of these: Make code accessible with these cloud services (Nature 7 November 2019). Try Binder @ https://mybinder.org/.
Friday, November 22, 2019

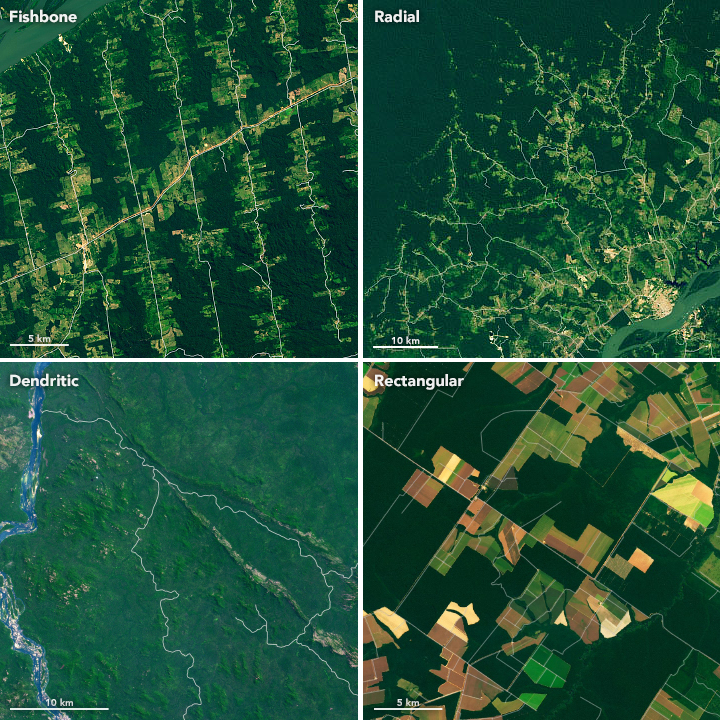
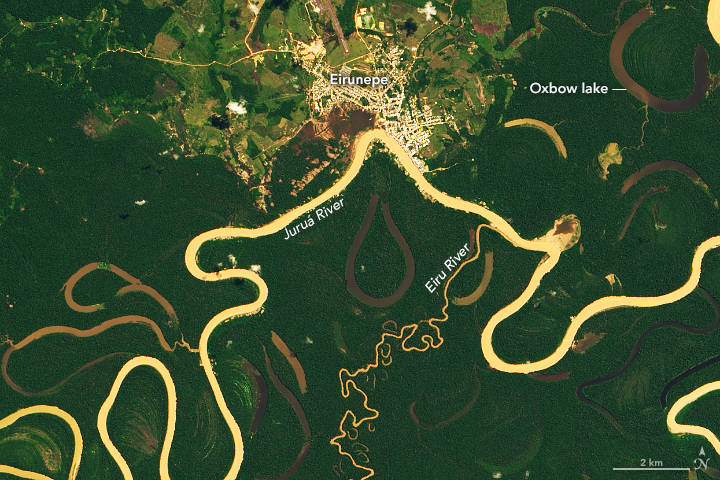
Making Sense of Amazon Deforestation Patterns
Making Sense of Amazon Deforestation Patterns shows some great examples of - well - spatial patterns of deforestation in the Amazon as seen from satellite images.
Thursday, November 21, 2019
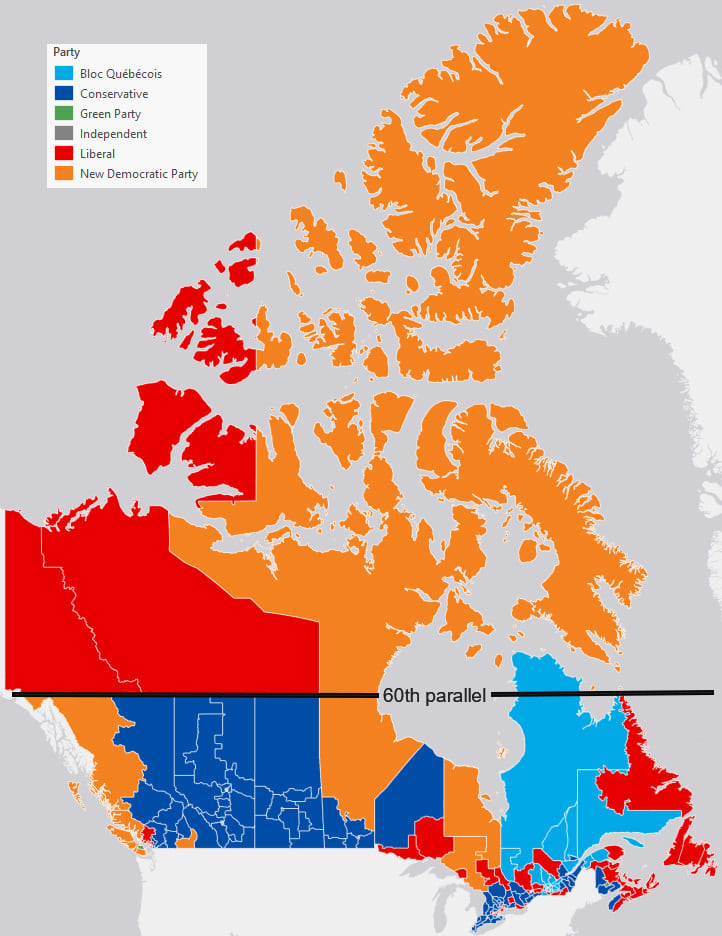
Mercator, it's not hip to be square
Good stuff from Ken Field: Mercator, it's not hip to be square. Quote: "Simply put, Web Mercator kills thematic maps." Perfect example: 2019 Canadian election maps.
Saturday, November 16, 2019
Wednesday, November 13, 2019
Tuesday, November 5, 2019
Infrared Radiation
The first 15 seconds (and the rest) show a nice example of infrared vs. visible radiation (aka light).
SLR Maps
There are a bunch of web-based interactive tools to visualize the impacts of sea-level rise - here are a few of them:
- Sea Level Rise and Coastal Flood Web Tools Comparison Matrix - National (by Climate Central)
- Coastal Risk Screening Tool - Global (by Climate Central)
Sunday, November 3, 2019
Python and ArcGIS Pro
Nice 4-part series about using Python in ArcGIS Pro by Olivia Iannone (Esri). Plus good courses offered by Esri:
Street Orientation
This is not all that new, but interesting: Road Orientations Map. Read more about it here: Visualizing street orientations on an interactive map. I always find these 'gridded' cities a little weird (being from Europe), especially those 'forcing' the grid over significant topography (e.g. San Francisco).